
Data visualization is the process of turning numbers into attractive charts and graphs. It’s an important way to make your data more accessible. It helps you figure out the meaning behind your data.
For example, if you log into Google Analytics, you’ll notice that all of your website data is displayed as a chart. Why does Google Analytics bother? Why doesn’t it simply give you the raw numbers? Because the visualization is far easier to understand, which makes it more valuable.
By placing data visualizations on your site – whether on public or private pages – you can help your team, colleagues, leaders, stakeholders, and audience understand the underlying data. Or you might use your visualizations as lead magnets to convince your readers to subscribe to your email list, buy your course, or otherwise become a deeper part of your brand.
How do you visualize your data on a WordPress page or post? With a quality charting plugin. The right plugin can help you create professional charts and graphs without any coding on your end. Here is our list of the best WordPress plugins for creating charts and graphs.
The right plugin can help you create professional charts and graphs without any coding on your end. Share on X1. GFChart
GFChart is a premium charts and graphs creator plugin. It helps you save time and quickly turn data into knowledge and share it with your readers, teammates, leaders, and stakeholders by turning your Gravity Forms data into professional graphs and charts. You can automatically display the latest results to page visitors in real time.
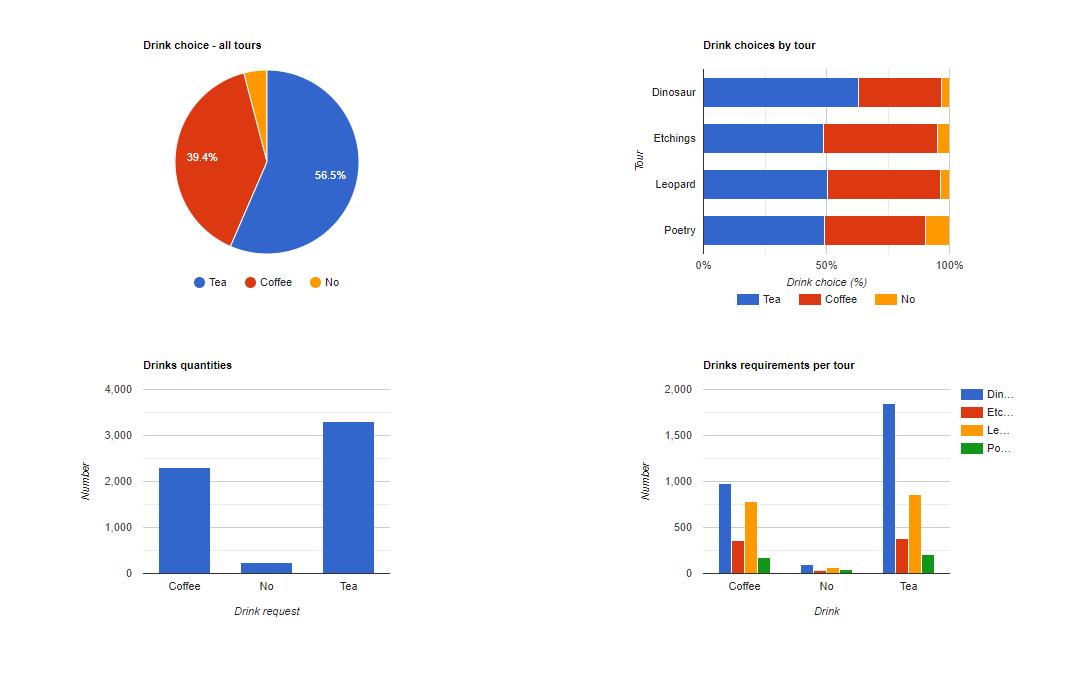
GFChart is an extension for Gravity Forms, the most popular forms plugin for WordPress. It’s easy to configure through an intuitive user interface. It’s ideal for surveys, registrations, sales & assessments.
What’s great about GFChart is that there is NO coding required. The visual editor is simple for any WordPress user. You can preview your charts and graphs in the editor before displaying them on a page. Displaying them only requires embedding a simple shortcode.
2. wpDataTables
wpDataTables is a popular charting plugin. In fact, it’s the plugin most WordPress users think of to make charts and graphs. It allows you to create responsive graphs to display on your pages and posts. You can even create tables that your user can edit, which will change the charts in real time. You can submit data by uploading a file or simply typing into the plugins editor.
A common complaint about wpDataTables, however, is that it’s quite complex to use. You’ll need to comb through a lot of documentation to set up your charts properly. Everyone strongly recommends using the wizard to go through the process of creating a chart step by step.
3. Visualizer
Visualizer is another table and charts WordPress plugin that helps you create fully customizable, interactive data visualizations for your site. The plugin’s free version offers nine types of charts. The premium version of the plugin offers extra chart types and email support. You can even create schedules to synchronize your charts with your online files (CSV, Google Sheets) or databases.
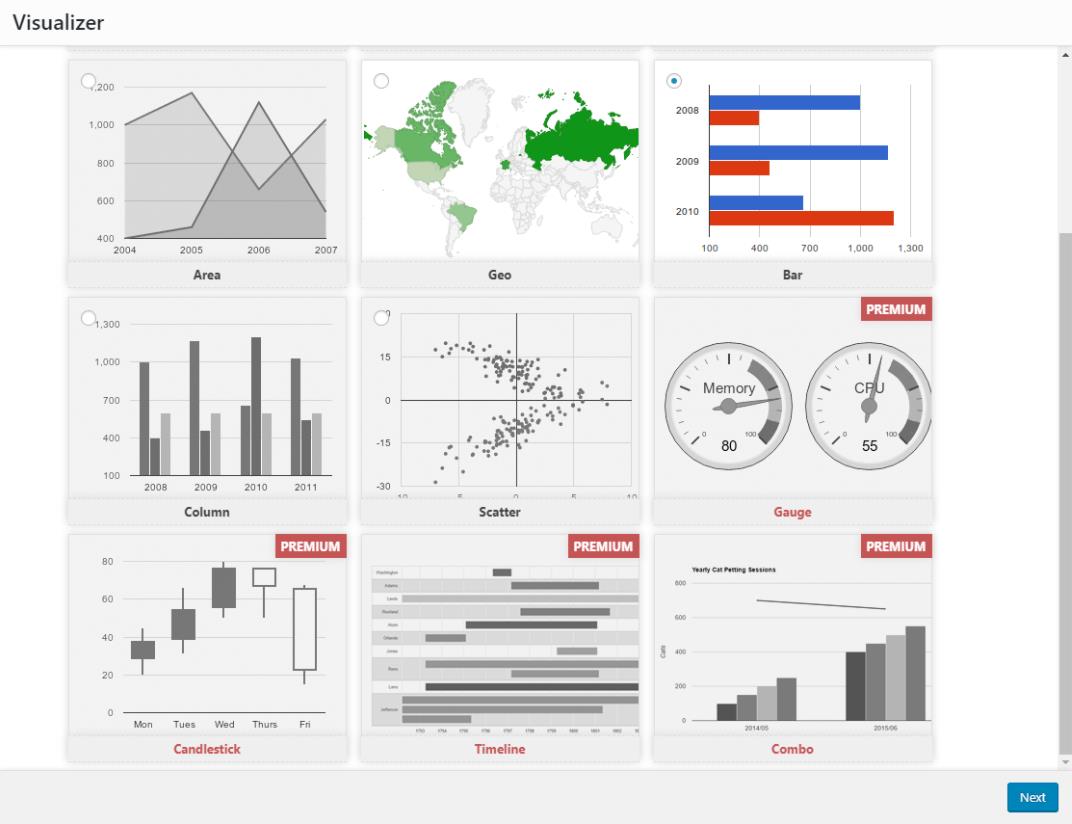
Furthermore, you can add advanced interaction controls to your HTML tables: pagination, instant search, filter results by text search, multi-column ordering, and many more. These make great pricing tables.
Visualizer offers a full 30-day money-back guarantee if you decide that the plugin doesn’t meet your needs.
4. MaxiCharts
Like GFChart, MaxiCharts is a WordPress chart and graph generator that pulls data from Gravity Forms submissions. It can also display data from CSV files.
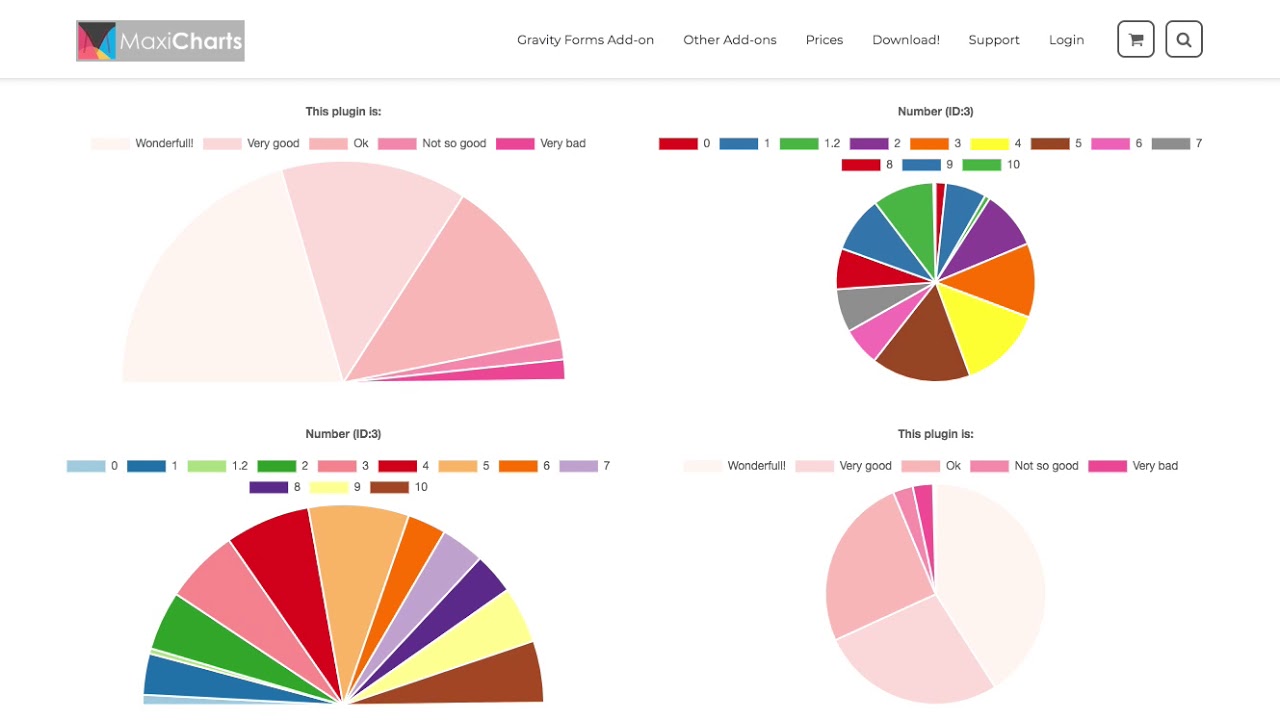
But unlike other plugins on this list, you work with MaxiCharts directly through a shortcode. Simply start with the shortcode [gfchartsreports] and then modify it based on your needs.
For instance, if you wanted to make a pie chart for Gravity Form ID:4 that’s 400 pixels high with your own custom colors, your shortcode would look like this:
[gfchartsreports gf_form_id=”4″ height=”400px” type=”pie” colors=”#ffe09b,#ffd09b,#ffc09b”]
The lack of a visual chart editor makes this a lightweight plugin, but configuring shortcode can be confusing, especially if you aren’t familiar with that kind of syntax. Nevertheless, the output charts and graphs are visually pleasing.
Important note: The MaxiCharts project has been entirely moved to Github.
5. Data Tables Generator
The free version of Data Tables Generator lets you create responsive tables to display your data. These are useful any time you want to display data but don’t think it needs a visual element. The plugin can structure information and can be adjusted to fit every need. Tables are responsive on all devices.
If you want to create charts and graphs, you will need the premium version of the plug-in. The charting is powered by Google Chart’s technology. You can create basic charts: bar charts, pie charts, line charts, bubble charts, and more. The plugin also allows you to import data from CSV, Excel, PDF, and Google Sheets.
Unlike other tools on this list, Data Tables Generator integrates nicely with WooCommerce. You can use it to create product tables that users can filter and search.
6. Formidable Forms
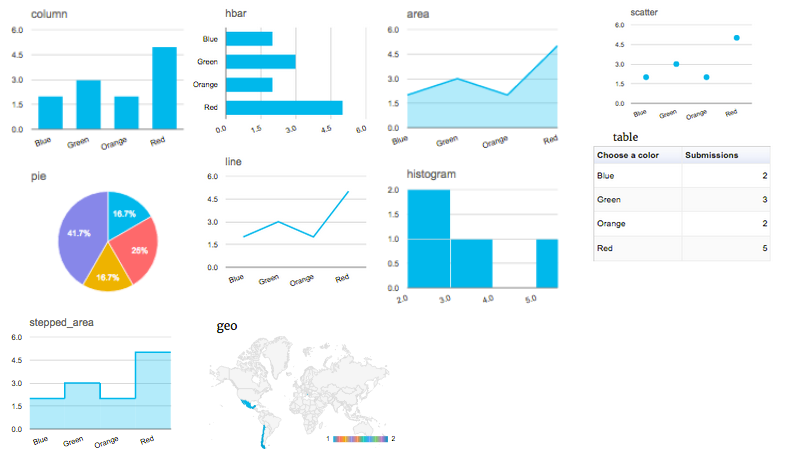
Formidable Forms is an advanced forms plugin for WordPress that lets you create charts and graphs based on the data collected by those forms. You can create column graphis, bar graphs, line graphs, pie charts, scatter graphs, histograms, area graphs, line graphs, stepped area graphs, and geographic heat maps.
Just like GFChart and MaxiCharts, you can display your graphs anywhere on your site by simply adding a shortcode. This means you can display them in pages, posts, sidebars, footers, and any widget area.
The downside, however, is that you can only use data that’s collected through Formidable Forms, which is not as popular or as powerful as Gravity Forms. If you want to style your graphs and charts, you have to do that through the shortcode, which is complex for new users. There’s no visual editor for your graphs and charts.
7. Easy Charts
Easy Charts is a free WordPress chart creator plugin that creates several kinds of charts. You can make bar charts, area charts, line charts, pie charts, donut charts, waterfall charts, and polar area charts. The charts are simple but serviceable.
Since this plugin is free, it doesn’t offer much functionality. For instance, you have to input all of your data by hand. You also can’t create responsive tables. But it’s still a decent choice for people who don’t have any budget for plugins.
8. WordPress Graphs & Charts
WordPress Charts and Graphs is a simple plugin that lets you create donut, polar, bar, line, bubble, scatter, and radar charts. Unlike other plugins on this list, you create the charts directly in the WordPress editor, not in a separate creator.
To use this plugin, simply hit the “Insert Graph” button on the WordPress editor. This opens a window to select the type of graph you want to create. Then complete the form to add your data, define labels and change colors. The plugin generates a preview of the graph as you edit. When you are finished, the charge will be automatically inserted into the content area using a shortcode.
Admittedly, this plug-in doesn’t have much functionality. You can’t change the type of chart once you’ve created it and you can’t upload data via CSV files. However, the simplicity of this plugin may be useful for some WordPress users who don’t have advanced needs.
Wrapping Up the Best WordPress Plugins for Creating Charts and Graphs
Charts and graphs are key tools to create attractive visualizations and help your readers understand your data. Without a charting plugin for WordPress, your data won’t be very engaging. Use the plugins we listed above to boost the quality of your content and turn your data into action.