
Like most websites, you use contact forms to give users opportunities to reach you. Some of your forms have specific purposes, such as event registration forms, job application forms, or survey forms. Other contact forms are more open-ended, like the general form on your contact page.
In most cases, these forms are simply routed to a general email address. You see each submission as they come in, one by one. These forms contain value, for sure, but it can be difficult to see what’s really going on because you never get a high level view.
In order to make smart decisions and optimize your business, you need to monitor the overall performance of your contact forms with visualizations. Visualizations help you understand the meaning behind your data and the overall performance of the forms.
For instance, wouldn’t it be helpful to know how many of your contacts are small businesses vs. enterprise companies? Or wouldn’t you like to know where contacts tend to discover your business or why most of them reach out to you? You can discover all of this, and report it in real time to your team and stakeholders, by simply mapping your form fields to cleverly designed reports.
In this article, we’re going to show you how to monitor your contact form’s performance using two tools: Gravity Forms and GFChart.
In order to make smart decisions and optimize your business, you need to monitor the overall performance of your contact forms with visualizations. Share on XStep 1: Download and Install the WordPress Plugins
First, download Gravity Forms. You only need the Basic license, though the Pro and Elite licenses offer lots of benefits and useful add-ons.
Next, download GFChart. Again, you only need the Basic license, but the All license offers some powerful benefits, like the personal assessment quiz and front end filtering. The All license also offers the charting against time graph, which can be helpful to monitor your contact form’s performance over time.
Once you’ve downloaded both plugins, install them the usual way. If you need help, WP Beginner has an excellent guide on installing and activating WordPress plugins.
Step 2: Build Your Contact Form
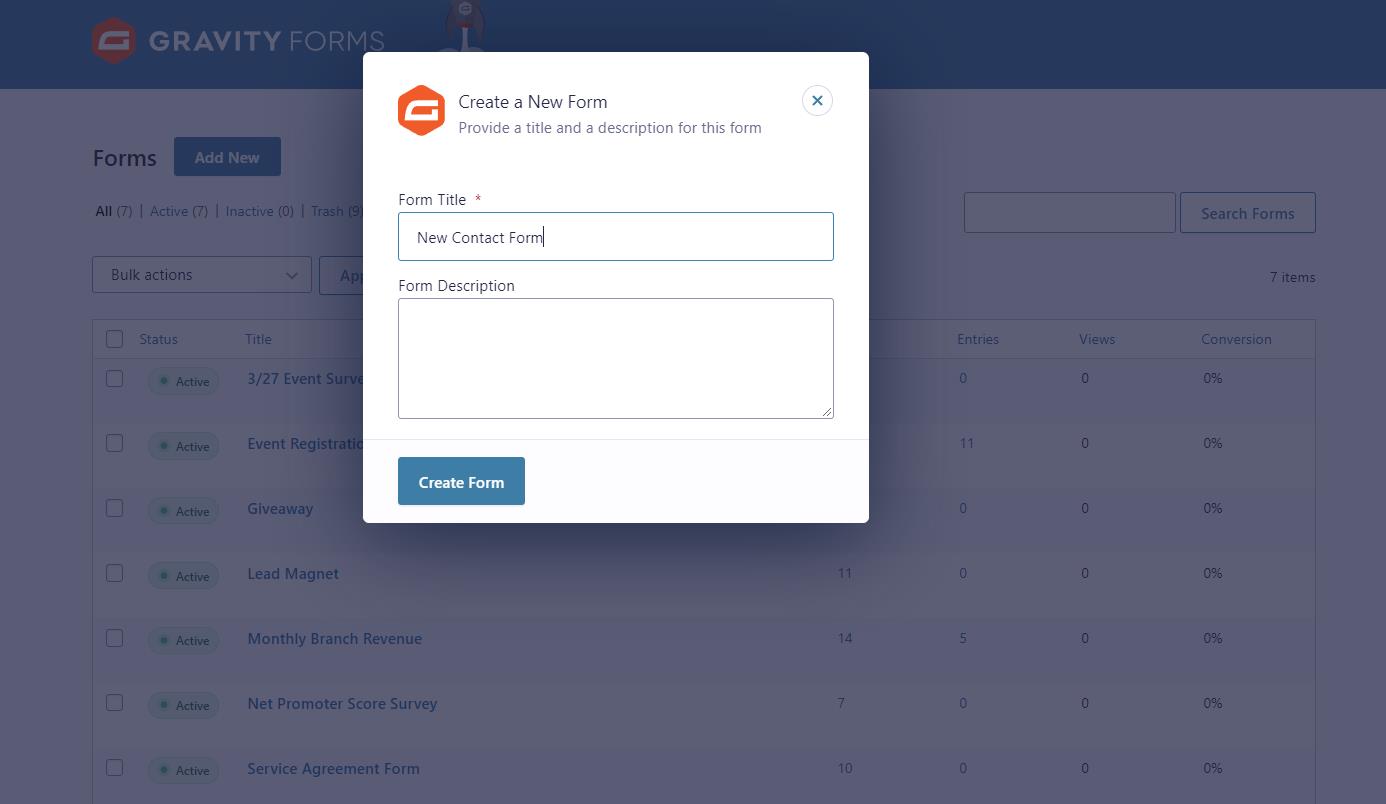
If you already have a contact form, you can skip this step. If you don’t have one, your next step is to build one. Click Forms > New Form on the left side of your WordPress dashboard. Give your form a name that distinguishes it from the other forms on your site. Then click Create Form to enter the form editor.
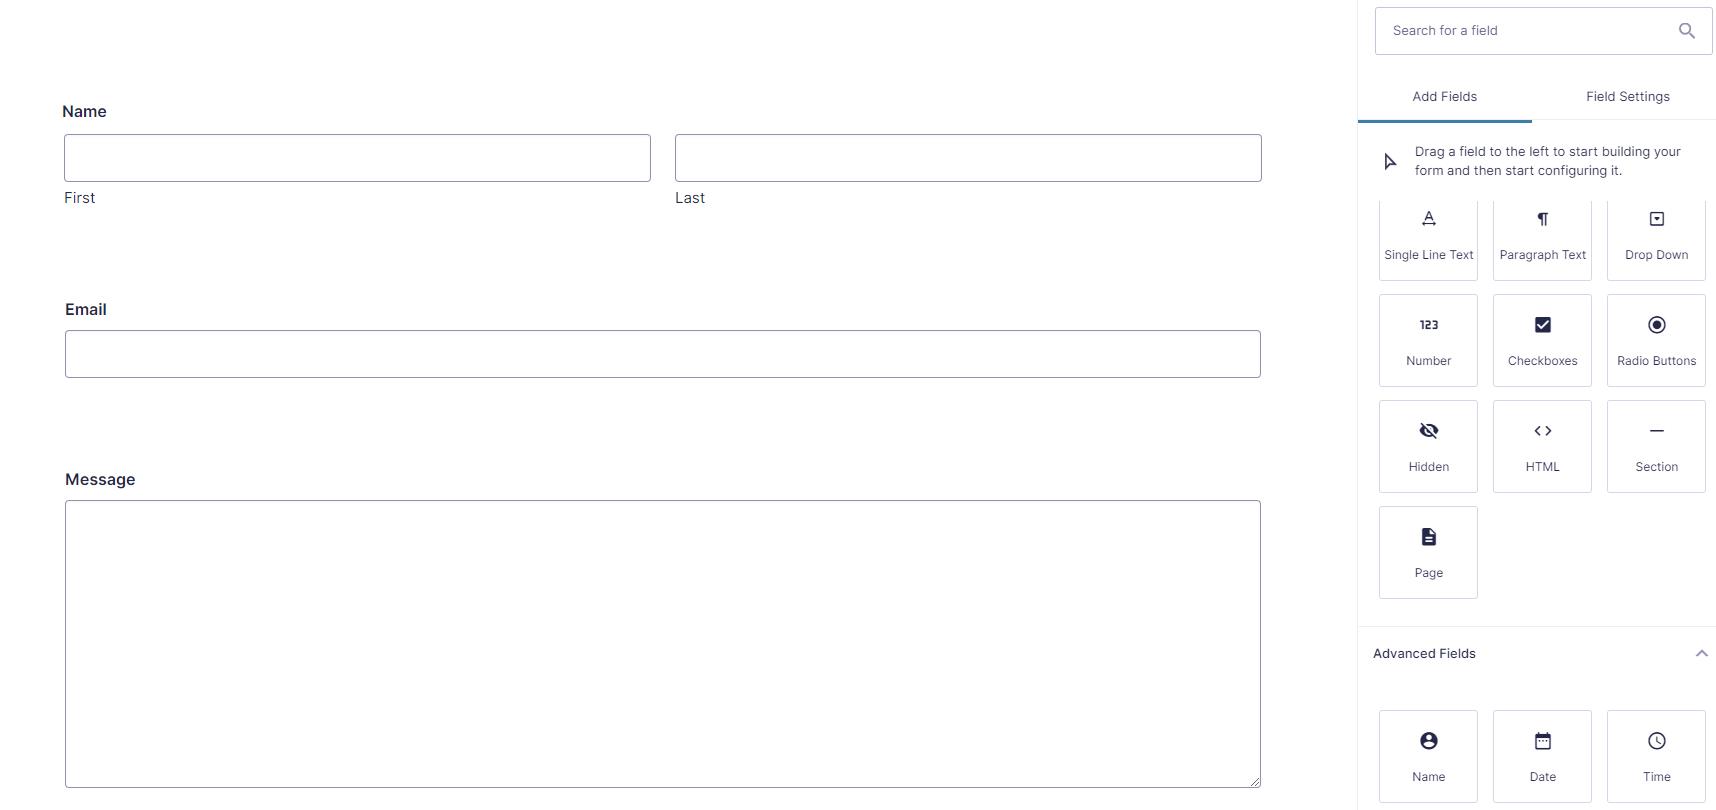
In the editor, you can add fields to your contact form. Contact forms are usually simple. You don’t want to add too many fields as this may dissuade your visitors from completing the form. Start by adding a Name, Email, and Paragraph Text fields from the options on the right. Your form will look like this.
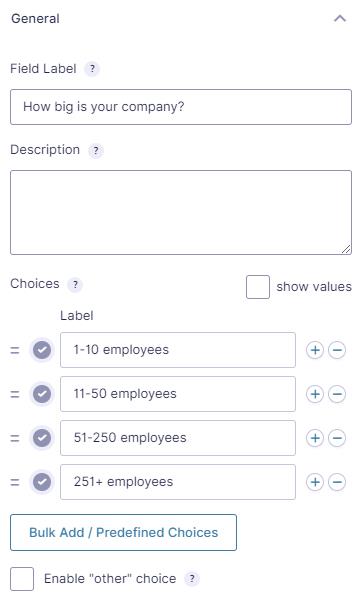
This is a pretty basic form, but you want to know a bit more about your contacts, so you should add more fields to help you understand exactly who is contacting you and why. For this example, we’re going to add a Radio Buttons field that asks, “How big is your company?”
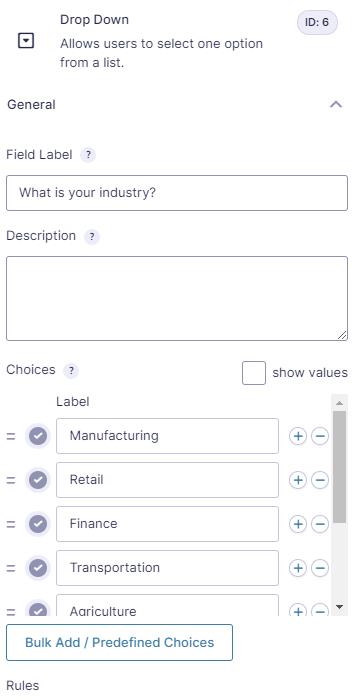
Let’s also add a Drop Down field that asks, “What is your industry?”
Once the form is complete, click Save Form at the top right of the page.
Step 3: Embed the Form on a Page
Now that your form is complete, you’ll want to make it available on the front end of your site for visitors to access. Open any page or post and add a Gutenberg Gravity Forms block.
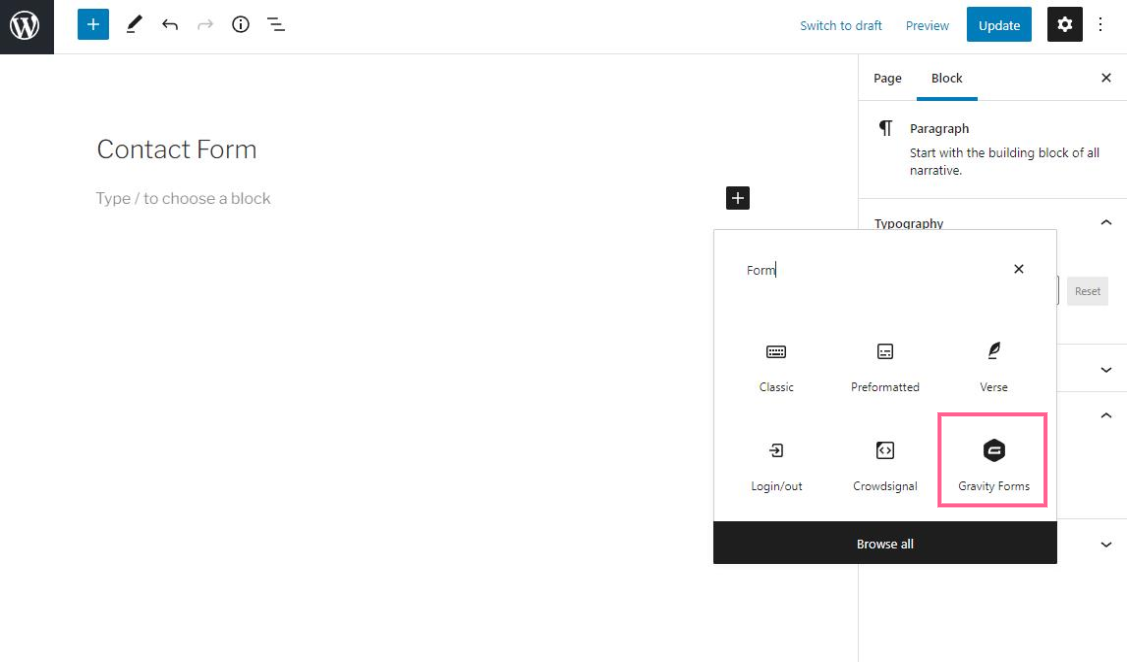
Then select your form from the drop down menu.
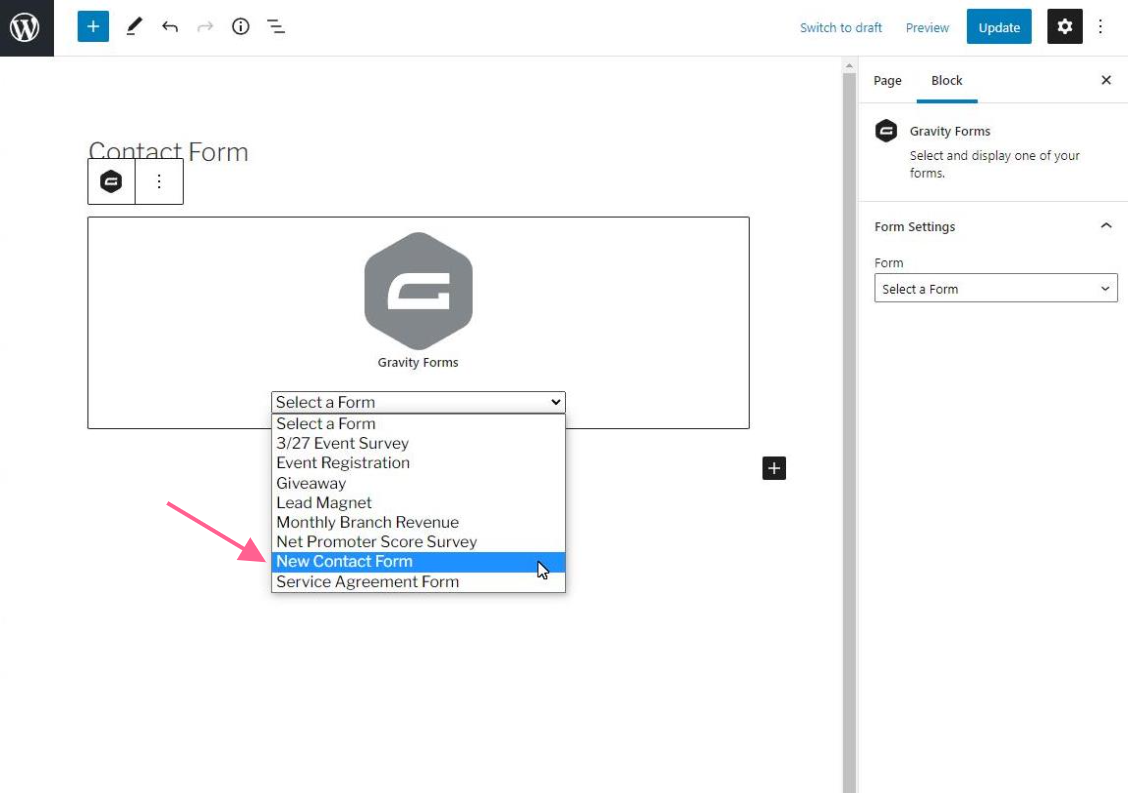
Finally, click the Update button on the top right of the page. Now your form is available for visitors to fill out and submit their information.
Step 4: Build a Chart or Calculation
In order to visualize your contact form’s data, you need to create a chart. Later, you’ll embed the chart on a page for everyone to see.
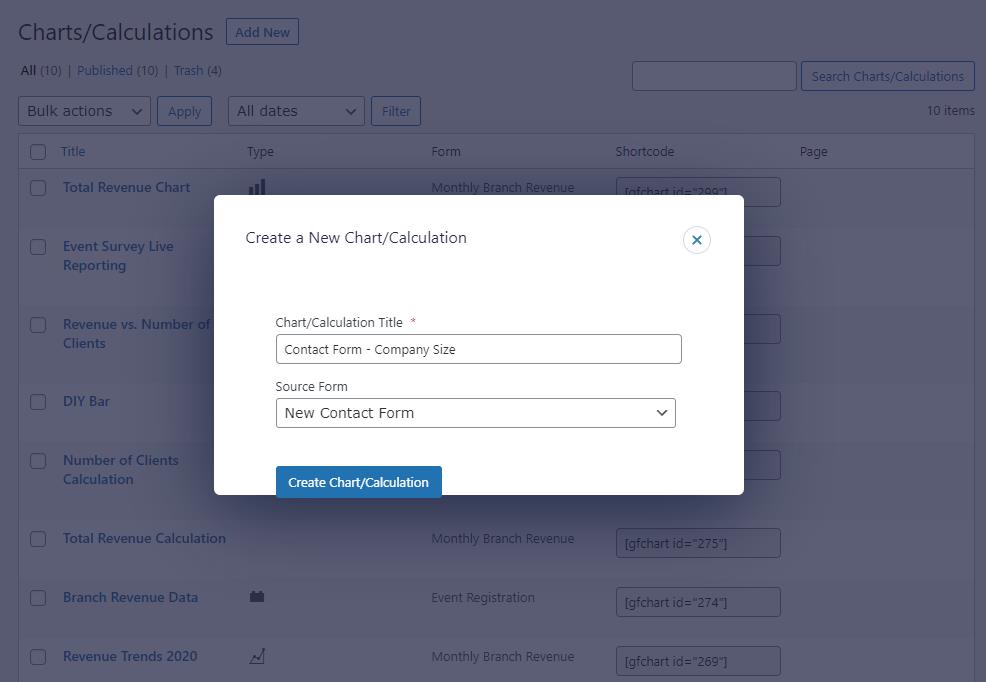
To make a chart, click Forms > Charts/Calculations on the left side of your WordPress dashboard. Then click Add New at the top of the page. Give your chart a name that distinguishes it from other charts you might create and then click Create Chart/Calculation.
The next page is the chart editor. This is where you’ll configure your chart to visualize the data that was collected by your contact form. For this example, we’re going to make a chart that visualizes the “How big is your company?” question. Let’s go through each tab of the chart editor.
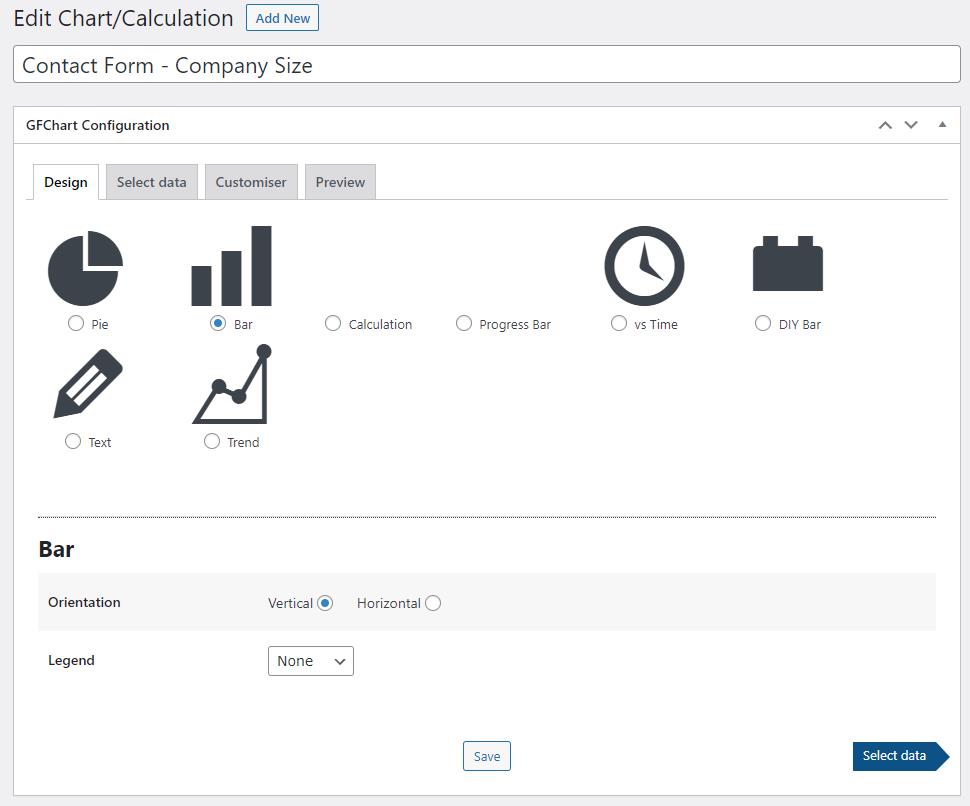
Design tab
Choose the chart that best suits the data you’re trying to display. Our company size question offers four categories, a Bar chart is most suitable, though a Pie chart could also work. If you wanted to show the change in response over time, you might opt for a vs. Time chart.
For the sake of this example, let’s go with a bar chart. Select the radio button under the Bar chart option, choose an orientation style, and click Select data to move to the next tab.
Select data tab
Here is where you’ll choose the data that will populate this chart. In this case, we want the X-axis to represent the question options (1-10 employees, 11-50 employees, 51-250 employees, and 251+ employees) and the Y-axis to count the responses.
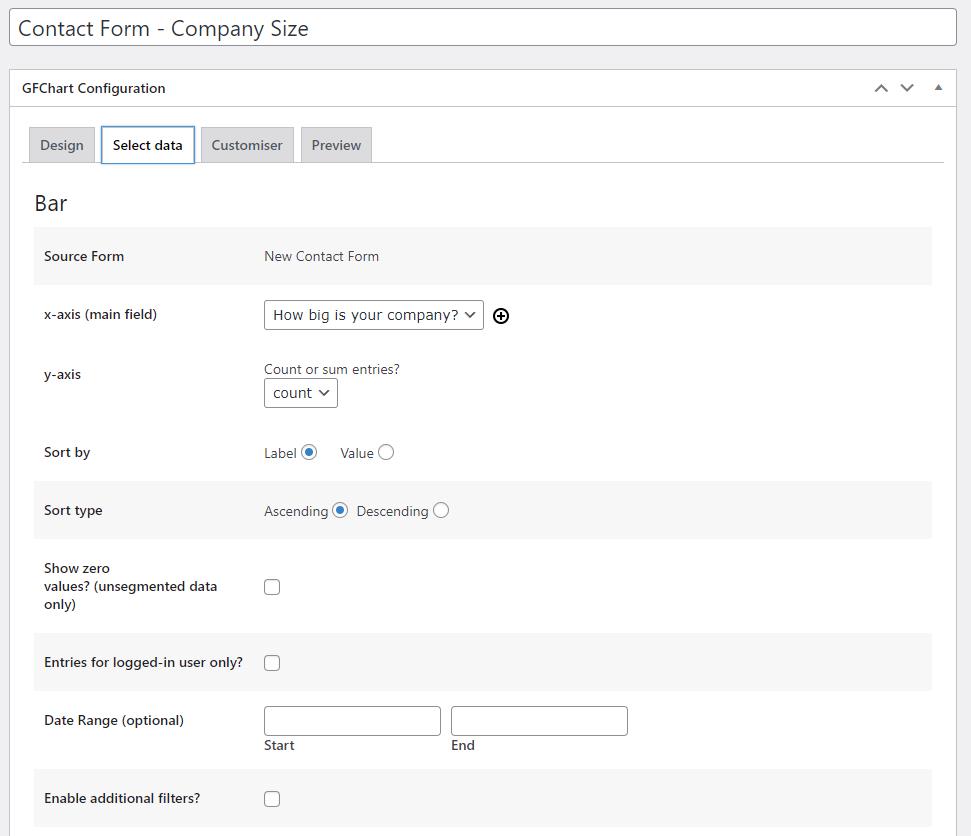
If you like, you could also filter this chart by date range. For instance, you may want to limit your chart to a particular month or the past 30 days. Read more about relative date range filtering.
Click Customiser to move to the next tab.
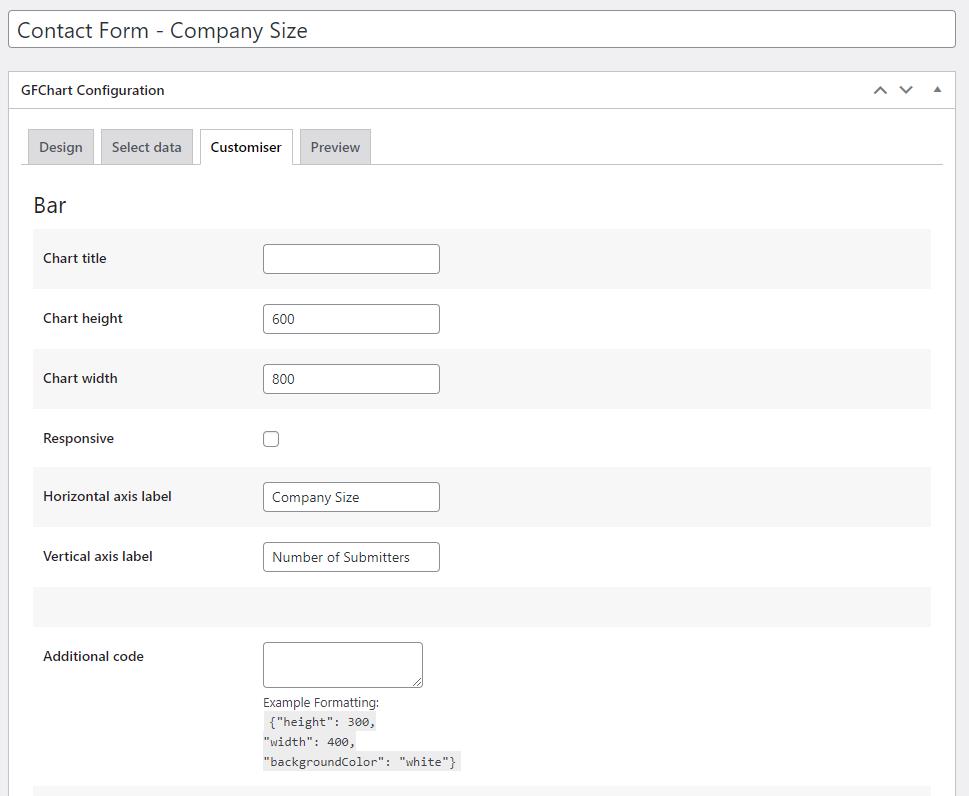
Customiser tab
This is where you can customize the look of your chart. You may want to tweak some of the details in order to make it look great on your page. You can give it a title, if you like, that will appear above the chart. You may also want to adjust the height, width, and colors to make the chart attractive wherever you intend to embed it.
We strongly recommend giving your axes their own names to help viewers understand exactly what the data means. In this case, we’ll call the X-axis “Company Size” and the Y-axis “Number of Submitters.” We’ll also bump the height and width slightly.
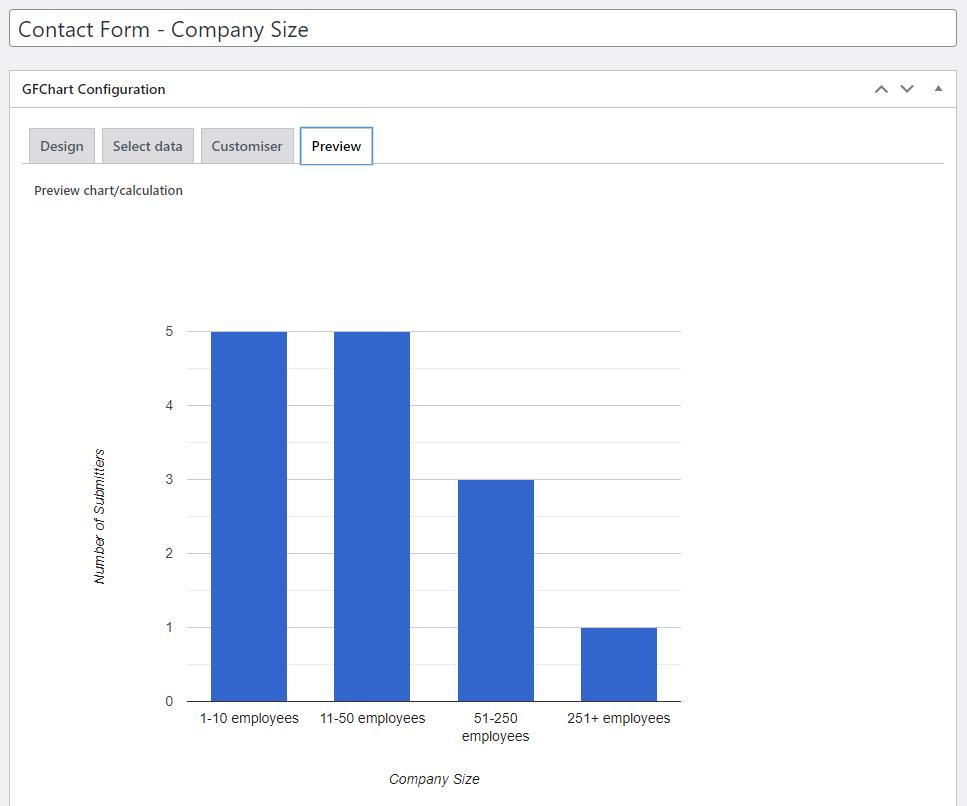
Preview tab
This final tab is where you can view the chart’s form as it will appear on the page. This is your opportunity to make sure the data is presented as you intend before embedding the chart on a live page. Here’s what our example chart looks like:
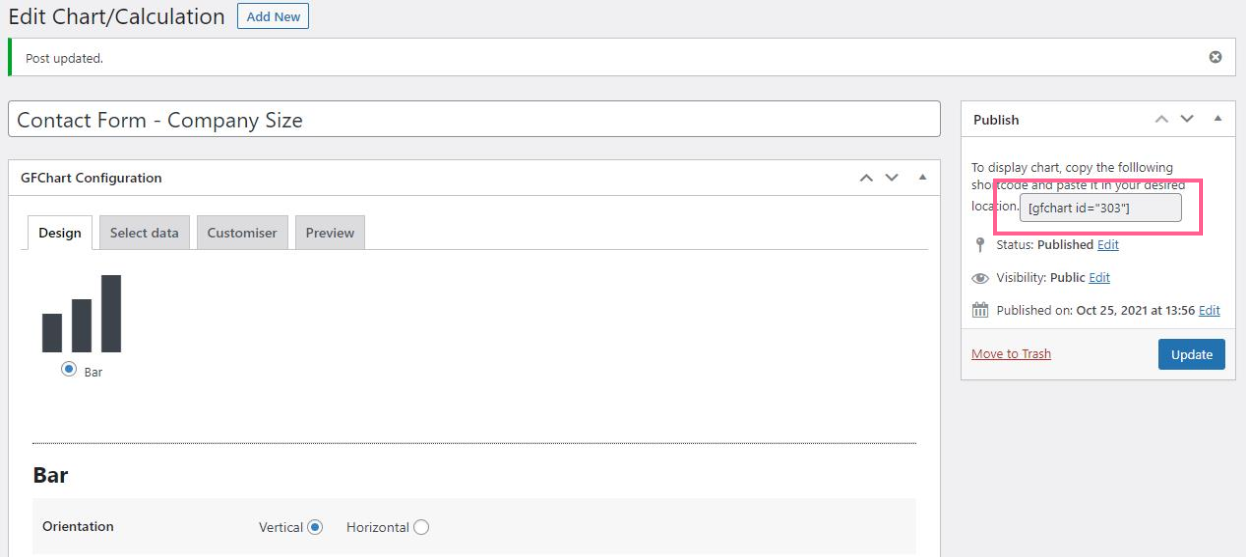
Step 5: Embed Your Chart on a Page or Post
In order to make your chart visible to colleagues, team members, stakeholders, and others, your final step is to embed your new chart on a live page or post. This is easy with GFChart. Simply grab the shortcode for the chart you want to embed from the chart editor page.
Then paste the shortcode into a Shortcode Gutenberg Block on any page or post.
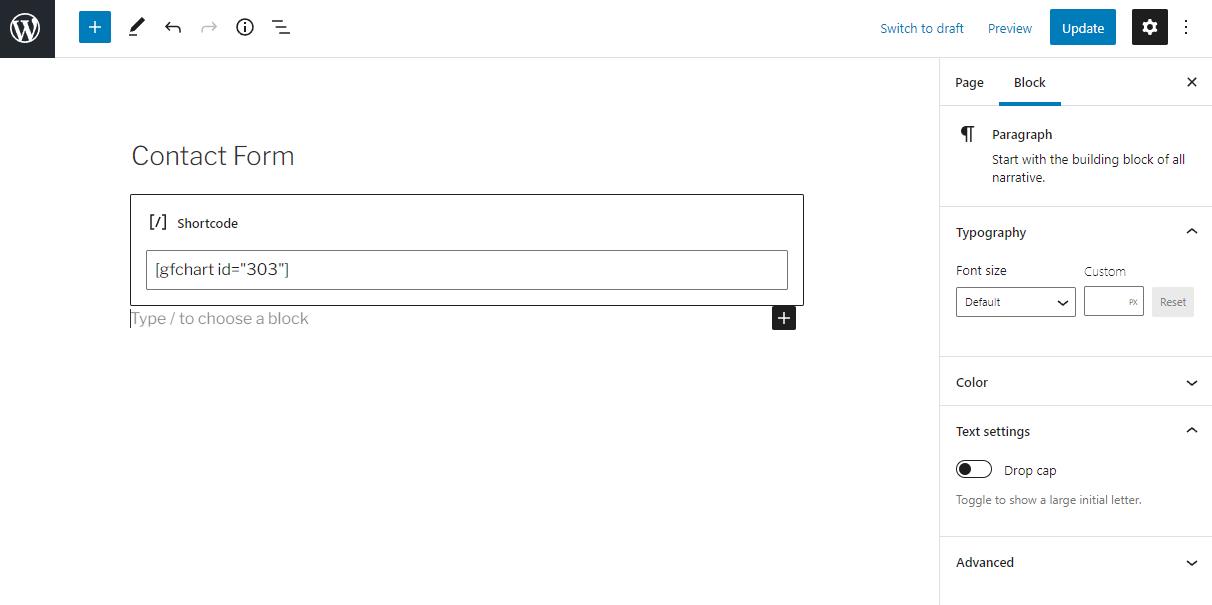
Click Update to save the page. Your chart will now appear on the front end version of the page. Anyone who can access the page will be able to see the data visualization.
Get Creative with Charting
Now, we only showed you a simple version of GFChart’s capabilities in order to walk you through the chart creation process. There’s a LOT more you can do. Experiment with different chart types and date filtering. Place multiple variables on the same chart to compare them together. You could even create separate charts for different groups of people within your organization based on their needs. For instance, sales might need granular information whereas stakeholders only want a high level view.
Most importantly, make sure to use the information you glean from your data visualizations. If your leads are coming predominately from one group, ask yourself how you can take advantage of it. Or you might wonder how to increase leads from the other groups. Data is only useful if you use it to take action.