
If you use Gravity Forms to process sales on your WordPress website, you know that the forms plugin sends a notification email every time a customer makes a purchase. It’s helpful to know when a sale comes in, of course, so you c an take the appropriate steps.
Unfortunately, these notifications don’t help you understand your sales in aggregate. That is, you can’t look at your notifications to understand your sales revenue as a whole. And they definitely don’t help you make decisions.
In this article, we’re going to discuss some options for monitoring your Gravity Forms sales. These techniques will give you and your readers a clear understanding of your data to help you make good decisions.
The Default Sales Monitoring Option
If you are the site administrator, you can view your sales results from a payment add-on (like Stripe, Square, or PayPal) by navigating to the form and clicking the Sales tab.
If you have multiple payment add-ons installed that support results, you will need to hover over the Results item and then select Sales in the submenu.
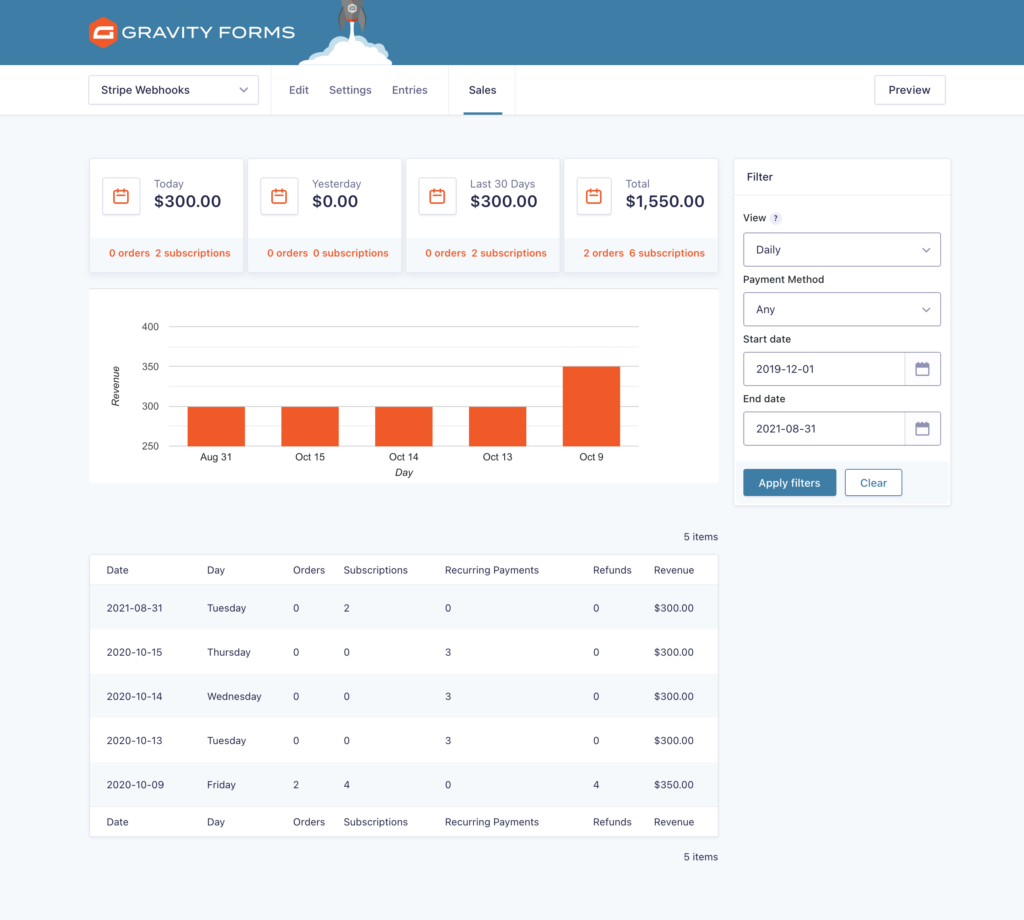
A dashboard will appear with some sales data. It offers some basic information about how much you earned today, yesterday, the last 30 days, and total. There are also some simple filtering options and a list of all of your sales.
The problem with this default reporting option is that you have to be the site administrator to view it. Obviously you don’t let everyone on your team use that account (who knows what they would do to your website, even accidentally), so this information is only visible to you. Your team, partners, vendors, and stakeholders are blind to your sales.
Furthermore, the default chart leaves a lot to be desired. All you get is a simple bar graph with basic data filtering options. There’s no way to change the type of chart or automatically send it off to someone else.
Can’t you export Gravity Forms data? Yes, but not in any visual way. You’ll get rows and columns of hard-to-understand data. This message is useful if you want to share specific data points, but it’s not very helpful if you want to understand your sales as a whole.
3 Better Ways to Monitor Your Gravity Forms Sales Data
How you monitor your Gravity Forms sales data depends on your needs, so we’ll offer a few options. You can choose the one that’s right for your business.
1. Display Data with Charts
The simplest and most effective way to monitor your Gravity Forms sales data is to create charts, graphs, and calculations to display on public pages and posts. With a well-designed chart, you’ll be able to visit a page to see a clear and up-to-date visualization of your data.
The simplest and most effective way to monitor your Gravity Forms sales data is to create charts, graphs, and calculations to display on public pages and posts. Share on XTo monitor sales this way, you’ll need GFChart (a smart extension for Gravity Forms), a simple way to turn your Gravity Forms data into automated reports.
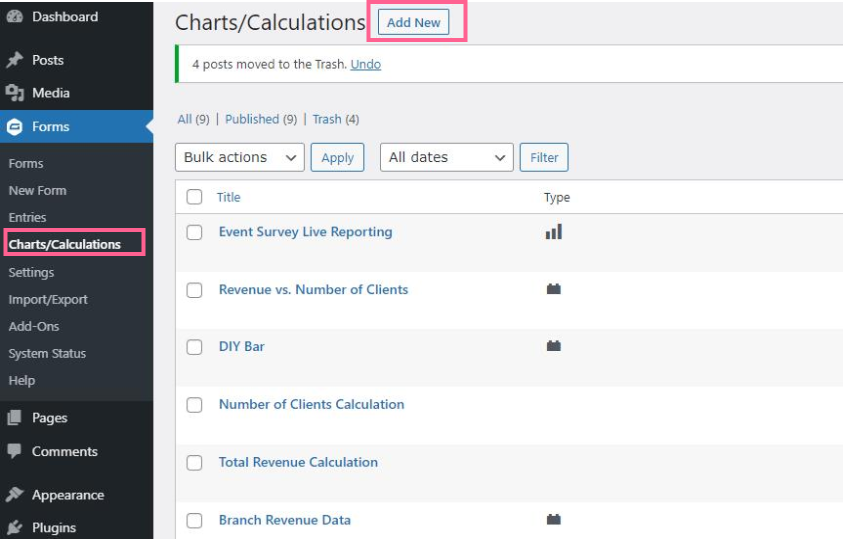
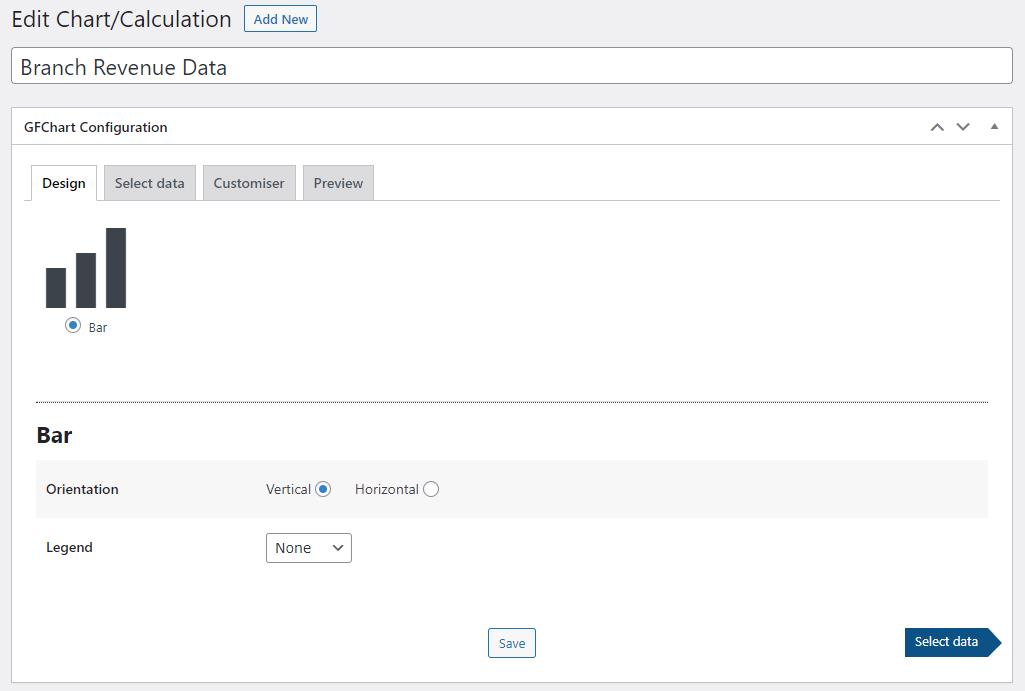
Add a new chart by navigating to Forms > Charts/Calculations in your WordPress back end. Then click Add New.
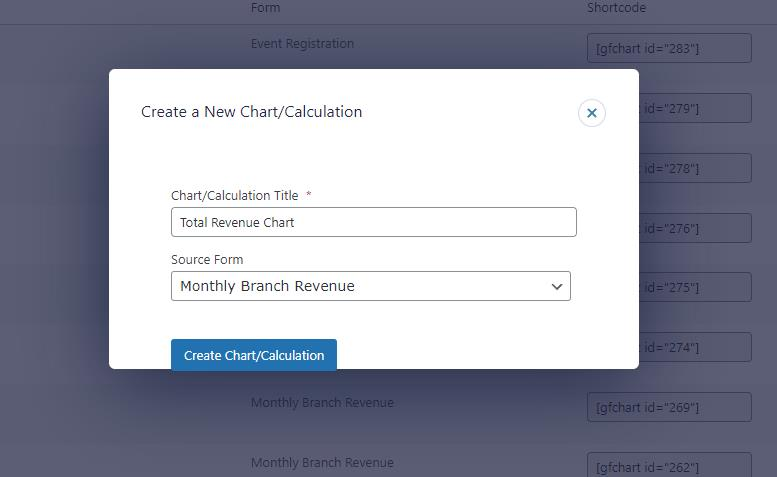
Give your chart a title that helps you distinguish it from other charts. Then select the form that will provide data for this chart. (To track sales, you’ll need an existing form that already processes sales.)
The next page offers four tabs. You’ll need to go through each tab, one by one, to configure your chart. (Don’t worry, it won’t take long!)
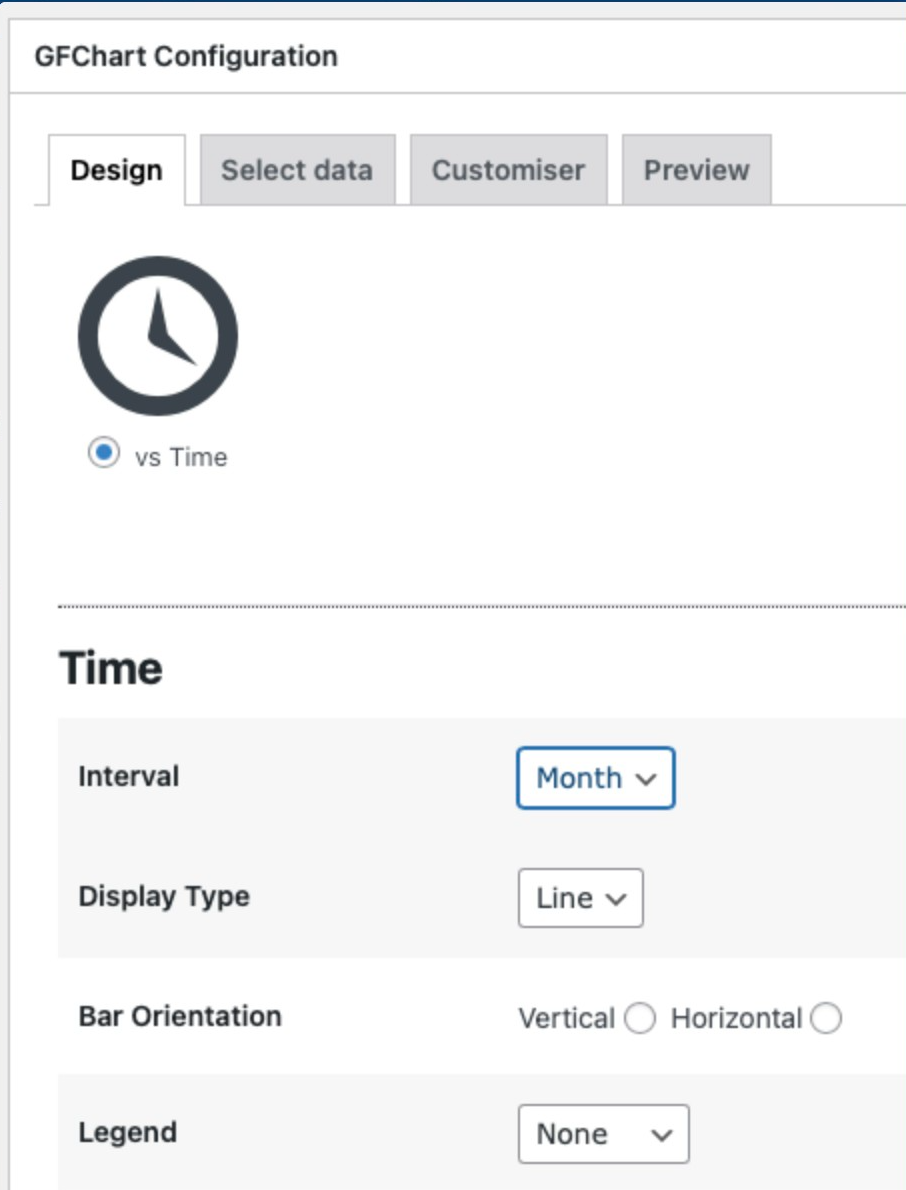
In the Design tab, choose the type of chart or calculation to display. As you can see, you have several options, but only a few of them apply to sales.
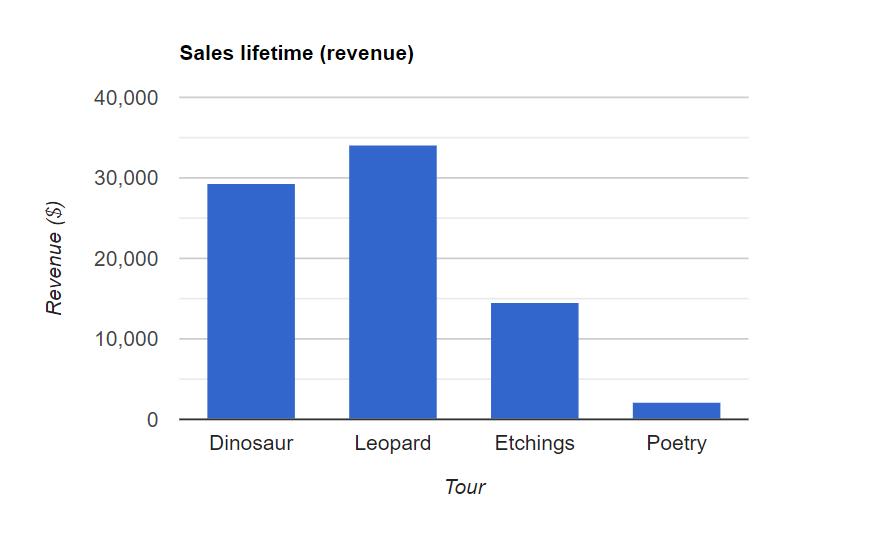
The “bar” chart is good for showing revenue according to non-nominal categories. For instance, you could show sales by client or by marketing channel.
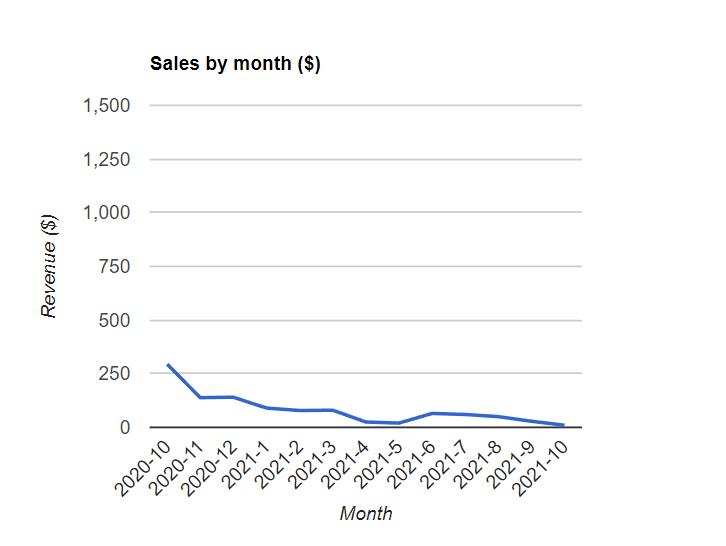
The “vs. Time” chart is good for showing sales over time. You could publish sales on a daily, weekly, monthly, or yearly basis. This is an ideal way to monitor trends. In GFChart, you can control the interval and display type.
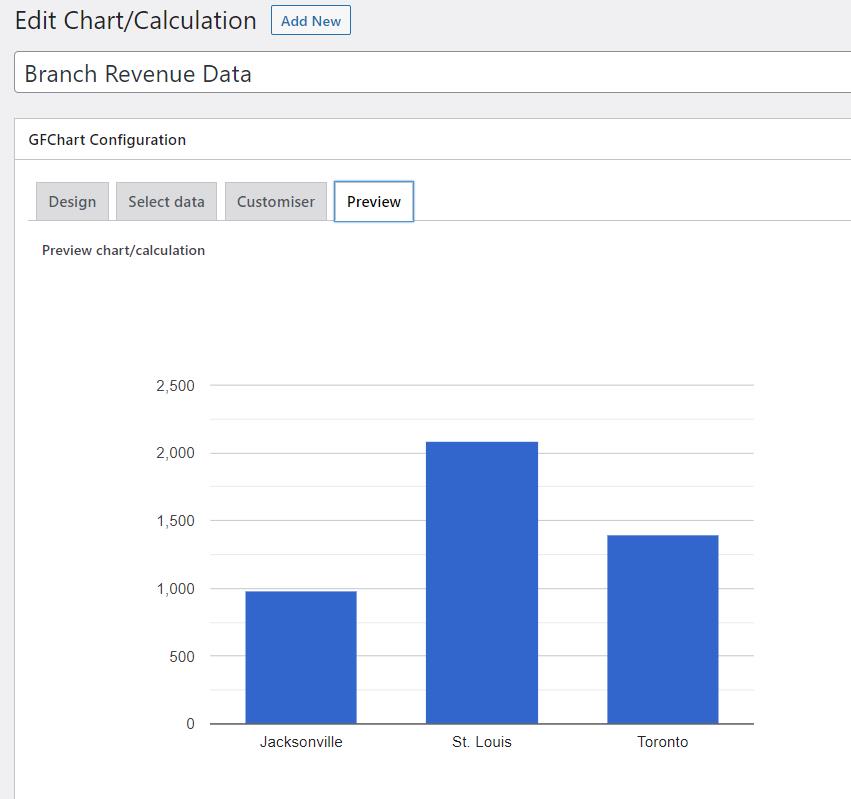
Here’s what looks like on the front end:
For example, let’s look at the sales of each of our company branches.
In the Select Data tab, map your X and Y axes and set other configurations. At the bottom of the page, you can select the chart’s date range. You can select a hard date range or a relative date range. For instance, you could set your chart to always show the previous day’s sales. Read more on relative date filtering.
You might also want to check the “Enable additional filters?” box at the bottom and add a few conditions. This gives you the opportunity to show portions of your data so you’re only displaying what your reader needs to know. For example, you may want to produce a chart that only shows one branch’s sales, even though your form collects all branch sales.
Next, edit the chart’s appearance in the Customiser tab. This helps you make the form appealing on the final page. View your final product in the Preview tab.
Your final step is to embed your chart on a page or post so others can see it.
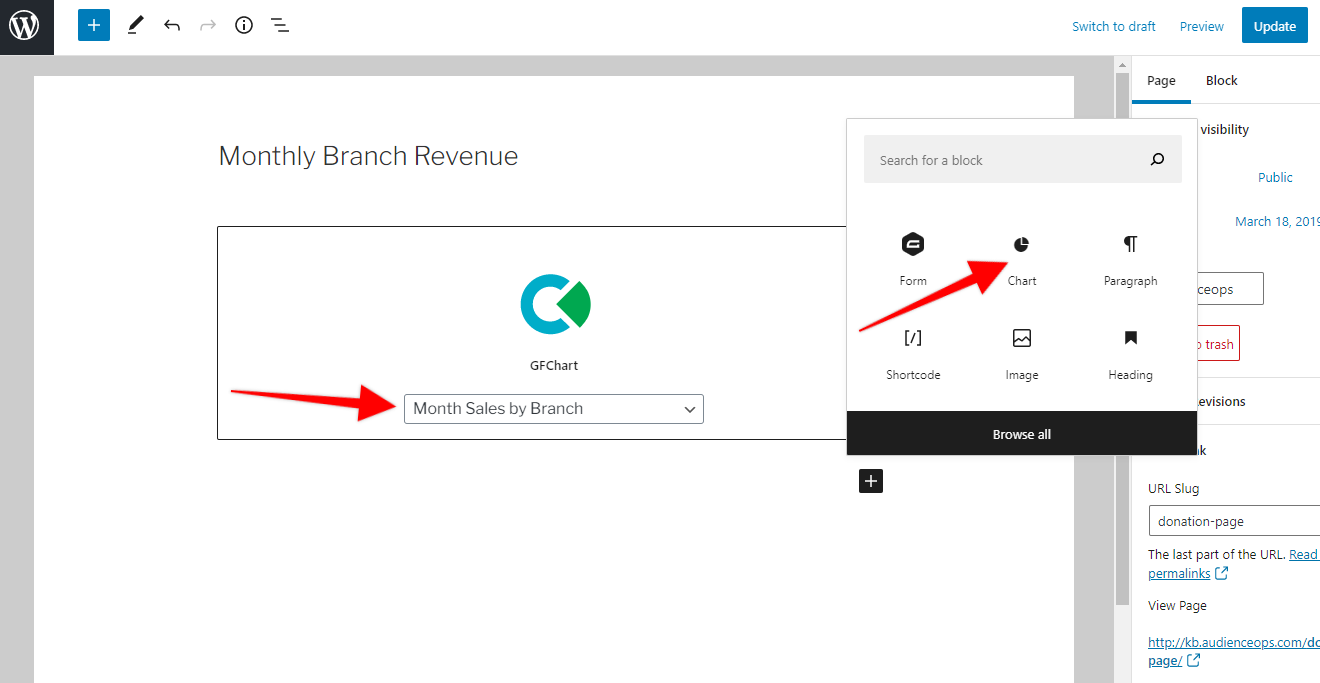
The easiest way is to use the GFChart Gutenberg block. Navigate to the page/post editor and add a Chart block. When the block appears in the content editor, use the drop-down menu to select the chart you just created.
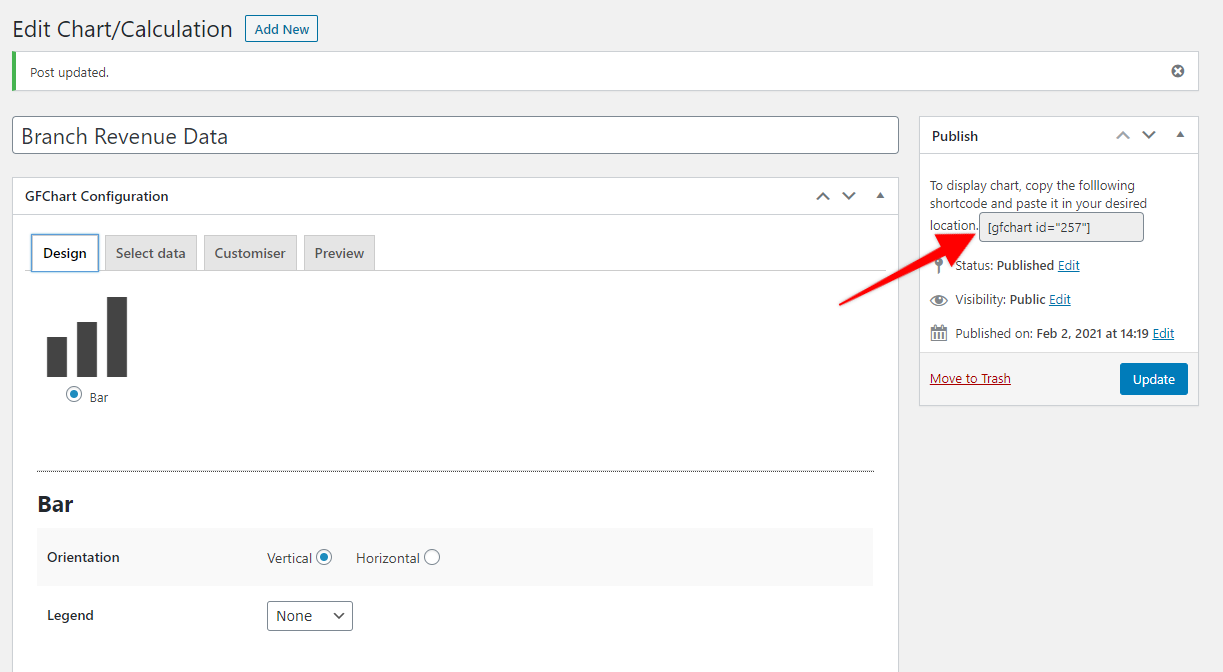
If you don’t use the Gutenberg editor, embed a chart using a shortcode. GFChart generates a shortcode for each chart. Find your chart’s shortcode in the chart editor.
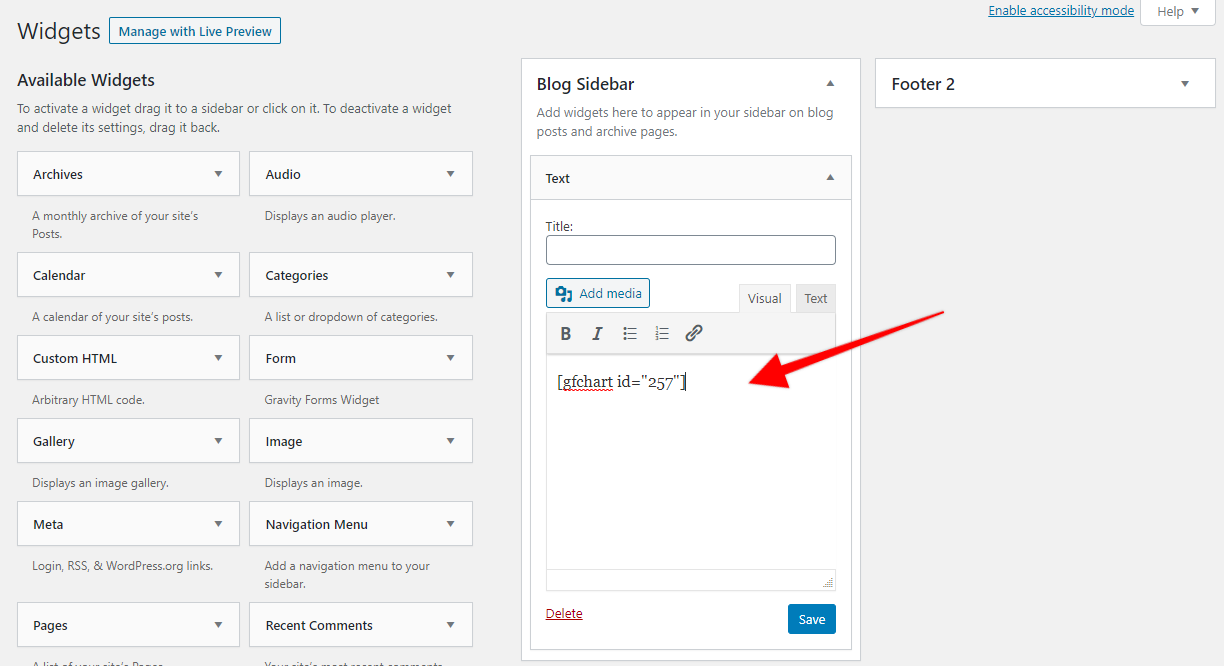
Add the shortcode to any content area, including sidebars and footers.
2. Display Data in a Table
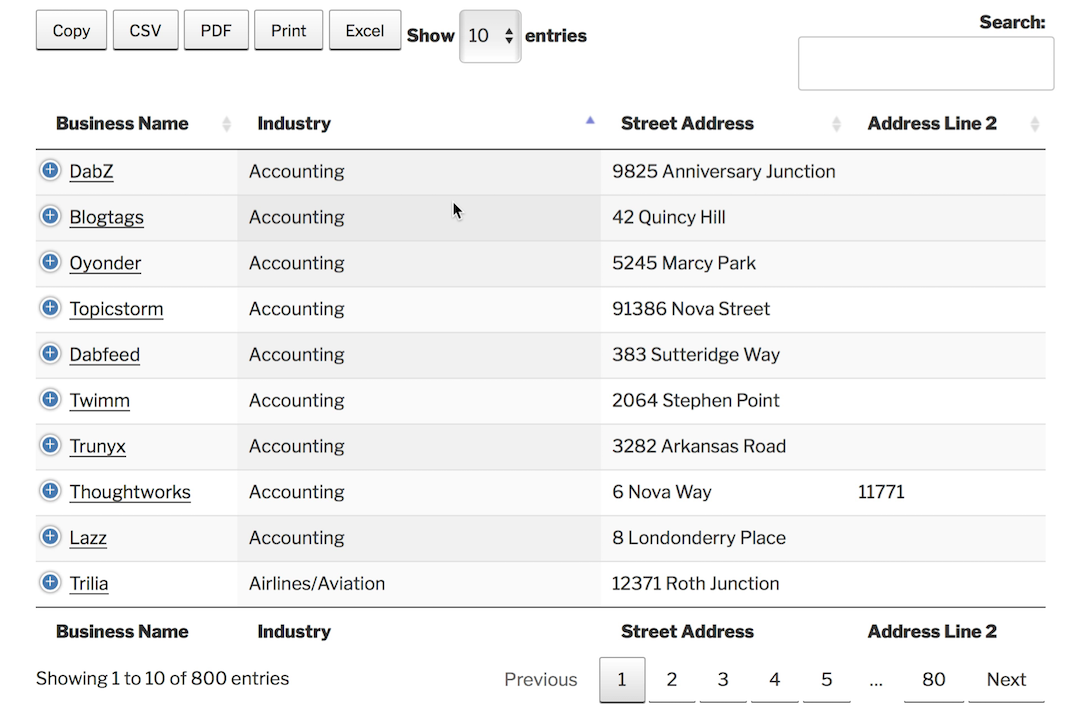
If you want to display your data as a simple table, but still want to make it available to someone other than the site administrator, we recommend using Gravity View. Gravity View lets you display your form entries to the front end without writing any code.
After installing and activating the plugin, click the menu on the left to add a new View.
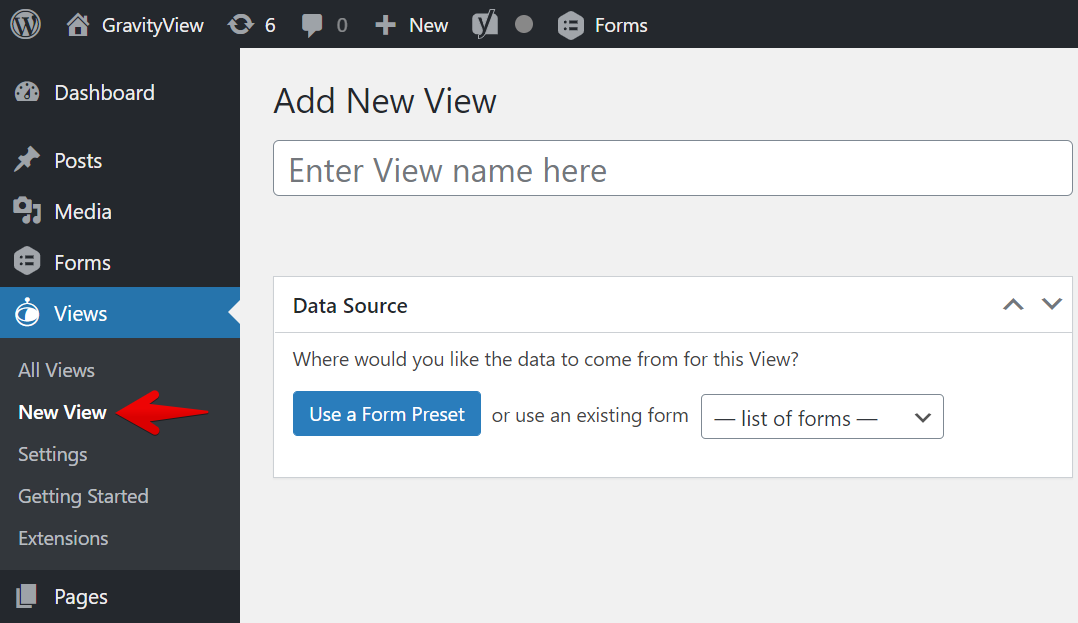
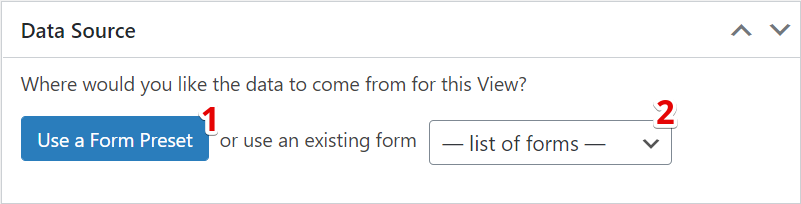
Next, define a data source so Gravity View knows where to pull information from. You can either Use a Form Preset or you can select an existing form in Gravity Forms.
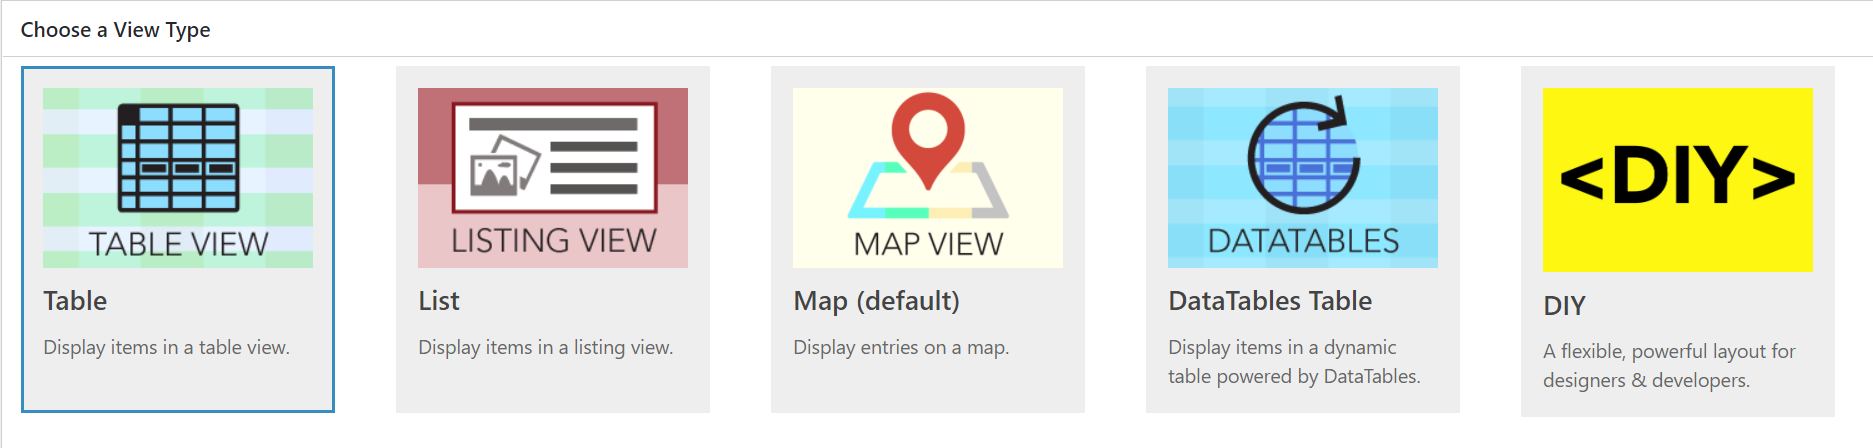
If you decide to use an existing Gravity Form as your data source, you will need to select a View Layout. The Table View and the Listing View are the most common layouts.
If you decide to use a form preset, GravityView will automatically create a new form. This form will contain different fields depending on the preset that you select.
GravityView will configure the View’s layout and populate it with various fields and widgets based on your selection. Presets include business listings, business data, people profiles, staff profiles, website showcase, issue tracker, resume board, job board, and event listings. These are helpful if you’re building a new form and want a head start.
After selecting a layout, you’ll see the View configuration panel. There are three tabs:
- Multiple Entries Layout: This is where your form entries will be displayed. Here is where you populate your view with widgets (tools for navigating your Views, such as Search Bars or Pagination links) and fields (the information that you display in your entry that correspond to the fields in your form).
- Single Entry Layout: This allows you to show more detailed information about a particular entry. This is useful if you adjust exactly which fields display for a particular entry. Add fields in the same way you did on the Multiple Entries tab.
- Edit Entry Layout: This allows you to specify which fields are editable from the front end.
Once your View is complete, your final step is to embed it on a page or post. This will make it available to the public (or whomever has access to that page or post).
Embed your View using the Gravity View shortcode: . ID refers to the ID of the View you want to display. You can customize the view using other parameters, as well.
For more detailed information, view the full Gravity View getting started guide.
3. Distribute Data in a PDF
If you want to display your data in a professionally designed PDF, we recommend using GravityPDF. This tool automatically generates and emails PDFs from Gravity Forms data.
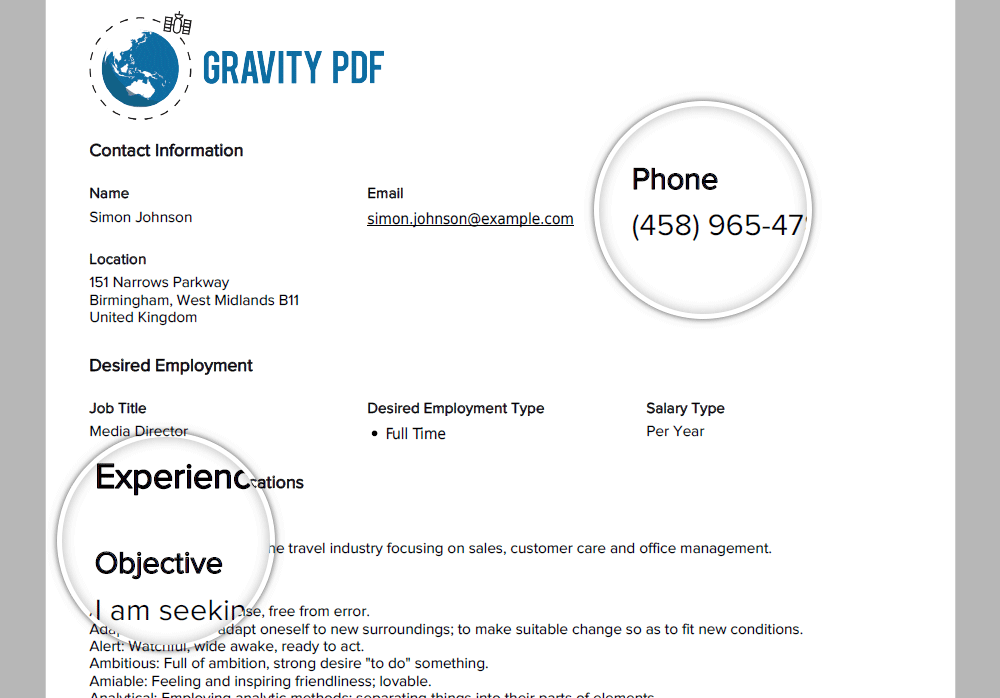
GravityPDF offers multiple out-of-the-box PDF designs, but they are highly customizable. If you don’t like any of their designs, you can buy a new one from their template shop, have GravityPDF make one for you, or design your own.
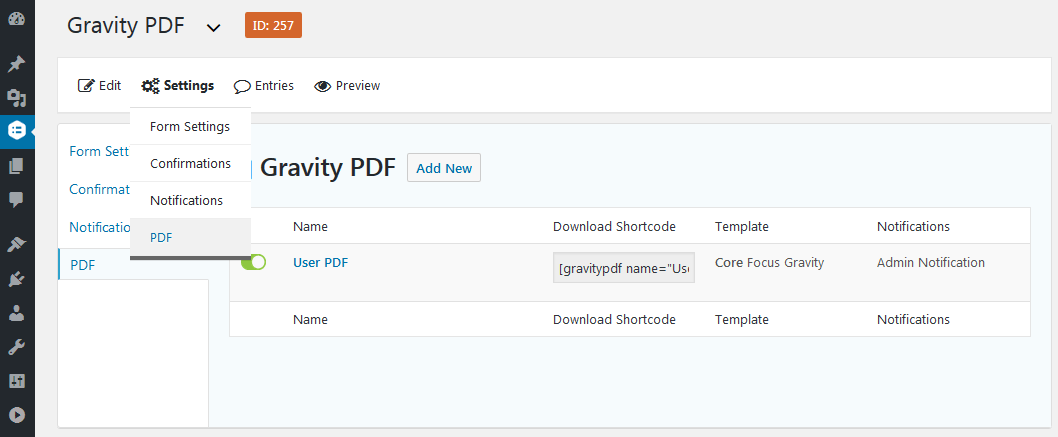
There are a number of settings to configure to set up Gravity PDF, so we strongly recommend reading their setup guide. When you’re ready to create a PDF, navigate to the appropriate Gravity Form. In the Settings drop down, click PDF.
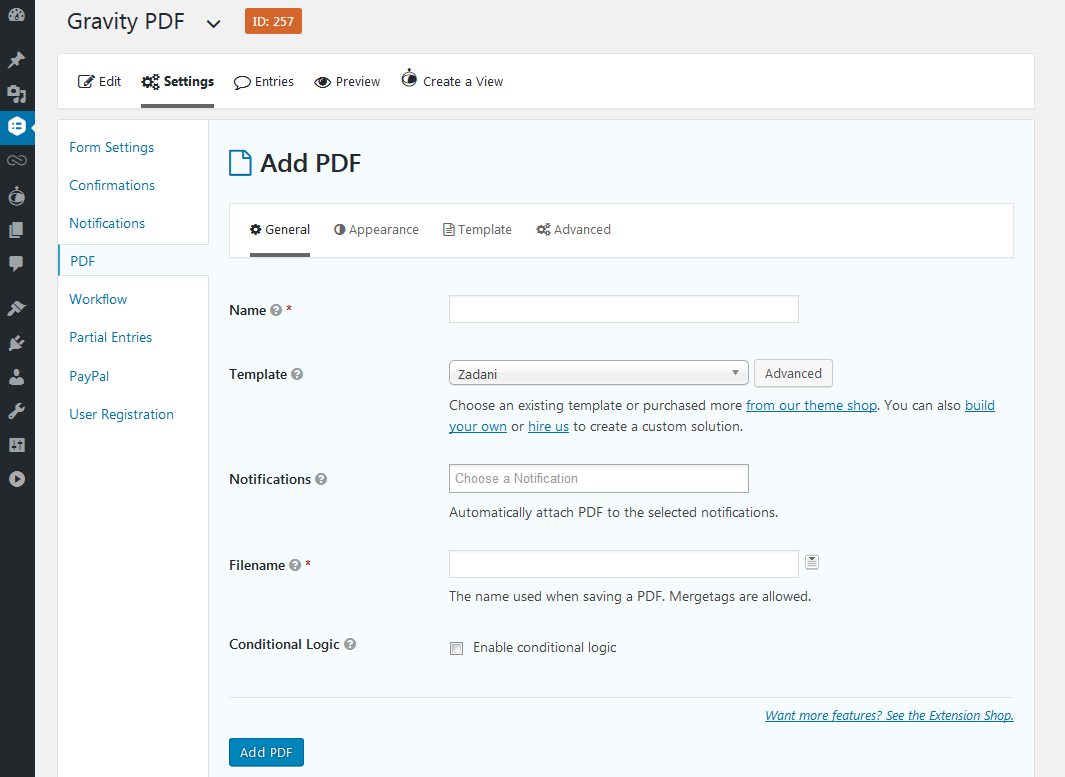
Go through the PDF options carefully. The Name and Filename settings are required. If you want the PDF automatically attached to a notification mail, make a selection in the Notifications field.
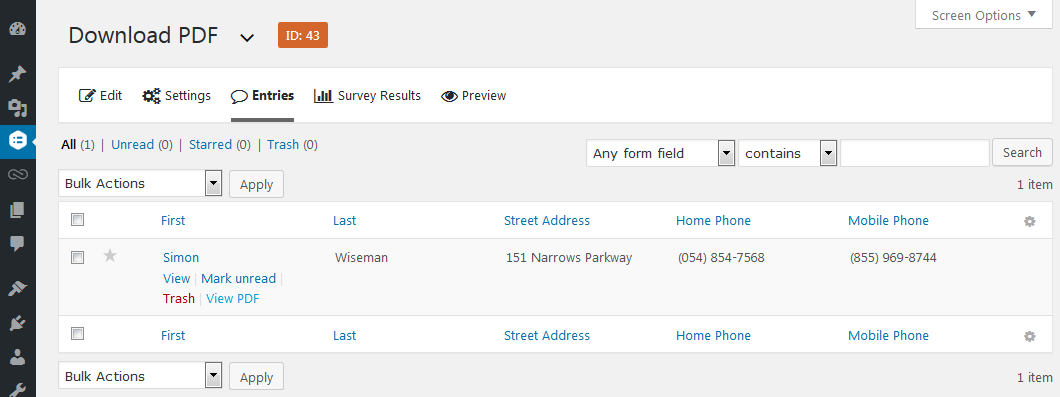
Once the PDF is set up, you can view and download it from the Gravity Forms Entries page in your admin area. (Make sure you have at least one entry first.) If you configured it to send an email, the form will send an email when someone submits the form.
You can also add a download link to a page or post. This will let anyone on the page download the PDF on-demand. You can do this by adding the shortcode to the page. Learn how to configure GravityPDF shortcodes.
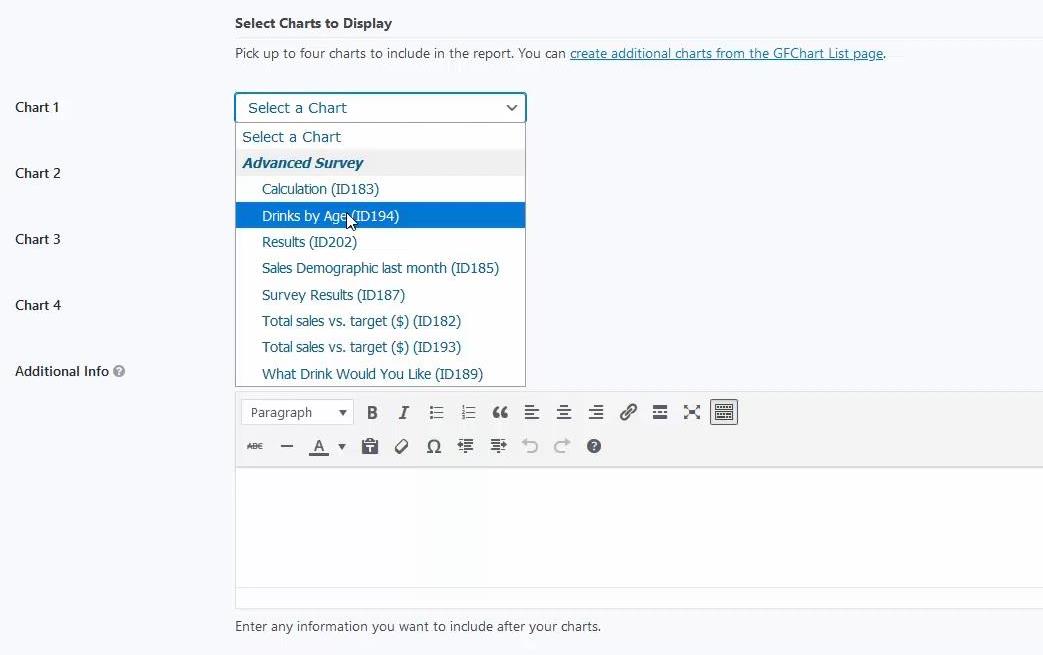
Additionally, you can add your GFCharts to your GravityPDFs. In the Template tab, simply select up to four charts that you would like included in your report.
Going Forward
Now that you understand several key ways to display your Gravity Forms sales data, we encourage you to create new visualizations right away. They are professional and engaging, but most importantly, they help you understand your data so you can make smart decisions for your business.