

Requirements
- Gravity Forms v2.3+ any licence type
- WordPress v4.3+
- Compatible with Chrome, Safari, Firefox, Edge and probably all other modern PC and mobile browsers.
Capabilities
- Pie Charts: type (normal, 3D and donut); autoscaling; legend (none/bottom/top/right/left/labelled); edit chart title.
- Bar Charts: type (horizontal and vertical); autoscaling; columns sorted by (label/value) (ascending/descending); legend (none/bottom/top/right/left/in); columns can optionally be segmented by an additional field displayed (beside/stack absolute/stack percent); y-axis calculated as entry (count/sum) of either x-axis field or another; edit chart title and axis labels. Note: segmentation is not possible with Gravity Forms advanced survey fields.
- Line Charts: only available in Charting vs Time add-on.
- Progress Bar: total is taken from an existing Calculation; manual input of Goal; specified as (number/currency).
- Calculations: calculated as entry (count/sum/average/unique values).
- Charting vs Time (available to premium GFChart All customers only): Bar Chart (horizontal or vertical), Line Chart (horizontal only), data by month, for current month and previous 12 months (13 in total), single data series, date is form submission date or a date field value.
- Filters (back end): logged in user only (yes/no); date range (optional, using absolute or relative dates); payment status (optional); optional field filters (is/is not/greater than/less than) which can be grouped using (all/any) logic; GravityView Approval Status (Disapproved/Approved/Unapproved); Gravity Flow workflow step / workflow status; Created By User; Created By User Role.
- Filters (front end): our premium GravityView add-on enables Charts and Calculations to update according to front end filters set by website users in GravityView.
- Filters (dynamic): available via shortcode.
- Other adjustments: height and width of charts; manual additions to Google Charts library code for changing colours, fonts, etc.
- Positioning: chart/calculation can be inserted into a post or page (using ‘Add Chart’ button) or into a widget (by shortcode cut/paste). Insertion to emails and PDFs requires our premium Image Charts extension, and GravityPDF for PDFs.
- Export/Import: charts/calculations can be exported and imported between WordPress installs.
- Pre-configured templates: GFChart Plus customers have access to a library of pre-configured templates.
- Responsive: GFChart is screen size responsive from v1.10.0. Note that responsiveness is switched off by default because it affects existing Charts.
- Gravity Forms v2.3 compatible: GFChart is compatible with the database schema changes coming in Gravity Forms v2.3.
Current limitations
- GFChart does not work with all field types. ‘List’ fields are not recommended. GFChart is also fussy about ‘Pricing’ fields, for example the ‘Product’ field using radio buttons works for both sum and count, as does ‘Total’, but there are issues with some others.
- Checkbox and multi-select checkbox compatibility was introduced in v1.6.0. Note that this does not support segments, summing, multi-select fields, checkbox/multi-select fields having separate values from their labels, advanced survey field checkboxes, check box in product fields, pie charts, calculations or filters. We recommend using other fields instead (e.g. ‘dropdown’ or ‘radio buttons’).
- Gravity Forms advanced ‘Survey’ fields: since v1.2.0 GFChart is compatible with these except ‘checkbox’, ‘multi-select’, multiple row ‘Likert’ and scoring ‘Likert’. Single ‘Likert’ is compatible. Bar chart segmentation is not possible (a graph will be produced but the labels will not display correctly).
- Gravity Forms advanced ‘Poll’ fields will not display well in GFChart.
- Line charts are only available in the Charting vs Time add-on.
- RTL language support is not available.
- A particular chart/calculation object can use data from only one form.
- There are no advanced statistical functions.
Installation
- Select ‘Get started now’ on the menu above. Follow instructions to pay and download plugin (GFChart.zip) to your local storage.
- Within WordPress install under ‘Plugins > Add new > Upload > Choose File > Install Now’ then Activate.
- Navigate to ‘Forms > Settings > GFChart’, insert license key from your purchase email confirmation, and press ‘Activate’.
License keys
GFChart All customers should use their GFChart All license key (ignore the many other license keys which are redundant!) Use of the correct single key will enable automatic updates for all plugins within the bundle.
Files to download
Depending upon your license level, you will see some or all of these files for download:
- GFChart.zip – GFChart core plugin file including Gutenberg block.
- gfchart-survey-customiser.zip – Advanced Survey Customiser plugin file.
- gfchart-image-charts.zip – Image Charts plugin file.
- gfchart-time.zip – Charting vs Time plugin file.
- gfchart-scheduled-notifications.zip – Scheduled Notifications plugin file.
- gfchart-gravityview.zip – GravityView add-on plugin file.
- GFChart_Sales_By_Year_Table.html – table template for reporting sales by year.
- GFChart_Sample_Sales_Report.json and other .json files – Pre-configured templates
- zadani-gfchart.php – a GravityPDF template for using Image Charts only.
Setup
This short video illustrates GFChart BASIC in use.
1. Create a New Chart
Navigate to the new ‘Forms > Chart/Calculations’ menu
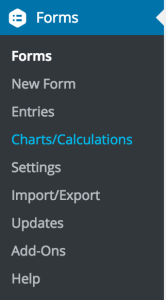
And click the ‘Add New’ button
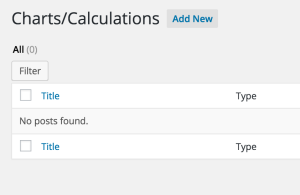
A popup window will appear,
- input a chart title. This is for your use only and will not appear in public.
- select the form where this chart will get its data. This setting cannot be changed in future.
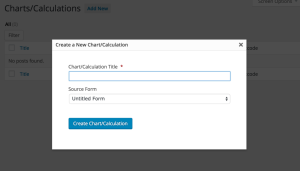
Click the ‘Create Chart/Calculation’ button and your new chart will be created!
2. Select Chart Type
Select your chart type
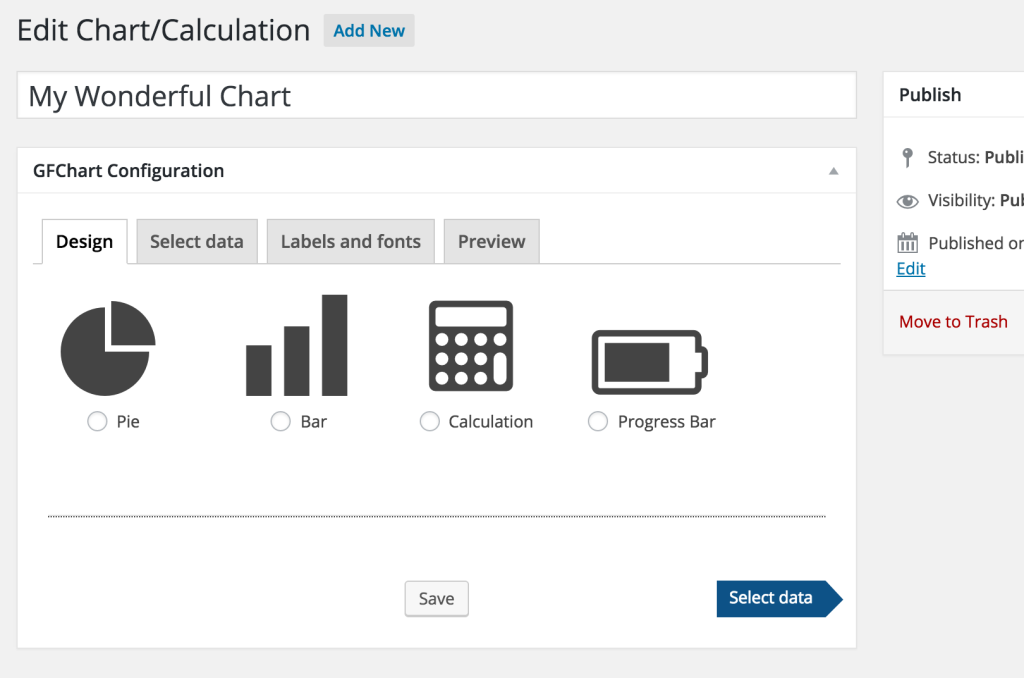
Chart types
- Pie charts
- Bar charts
- Calculations (a calculation, not a chart)
- Progress bars
- Chart vs Time (only available to premium customers who purchased the GFChart ALL package)
- Text (only available to premium customers who purchased the GFChart ALL package)
- Trend Coming soon for GFChart ALL customers!
Pie Charts
After selecting a Pie chart the ‘Design’ tab will change to this
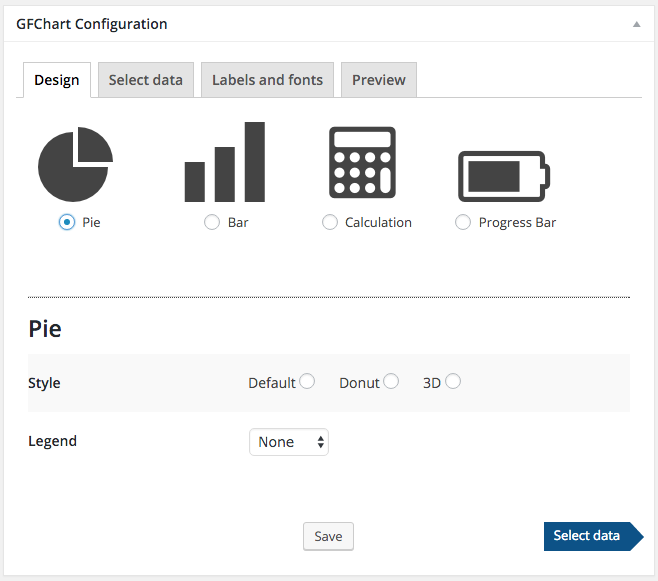
Style options:
- Default: standard circular pie chart
- Donut: standard pie with a large hole
- 3D: pie tilted to create a 3D effect
Legend options:
- None
- Bottom
- Top
- Right
- Left
- Labeled
Once these selections have been made press ‘Select data’. Note there is no need to press ‘Save’, this button is for use if changes are made in future.
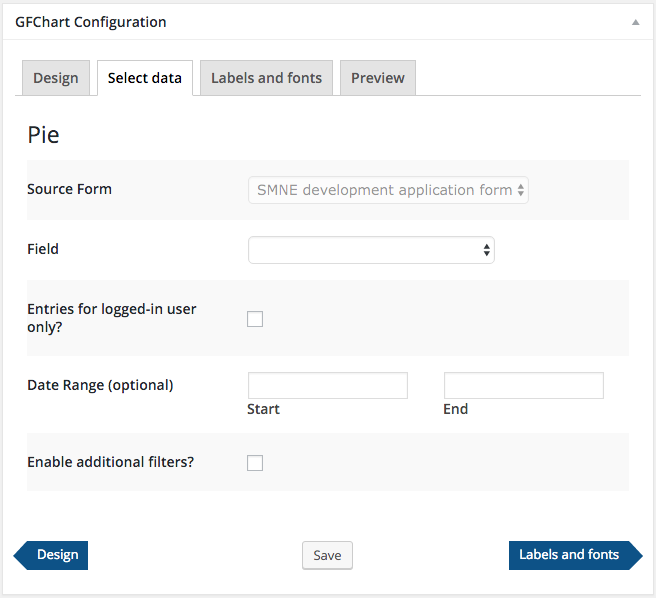
Source Form: this field was already set when the chart was first created and cannot be edited.
Field: select the data field to plot.
Entries for logged-in user only: check this box to display entries for only the logged in user (ideal for personal quiz results).
Payment status: this is an optional filter. To activate the filter insert the text generated by your particular payment gateway. For information on how to identify the text, see here.
Date range: this is an optional filter.
Enable additional filters: check this box to trigger additional filtering.
Once these selections have been made press ‘Labels and fonts’. Again, there is no need to press ‘Save’, this button is for use if changes are made in future.
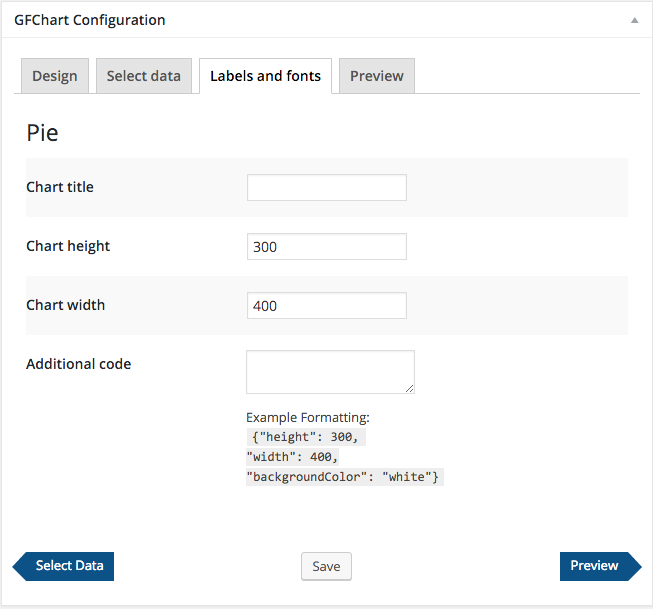
Chart title: insert the text that will be published above the pie chart.
Chart height: in pixels
Chart width: in pixels
Responsive: (available from v1.10.0) check for screen size responsiveness. This is switched off by default because it will affect existing charts.
Additional code: This can be used to change colours, fonts etc. Leave blank by default. Usage instructions appear below.
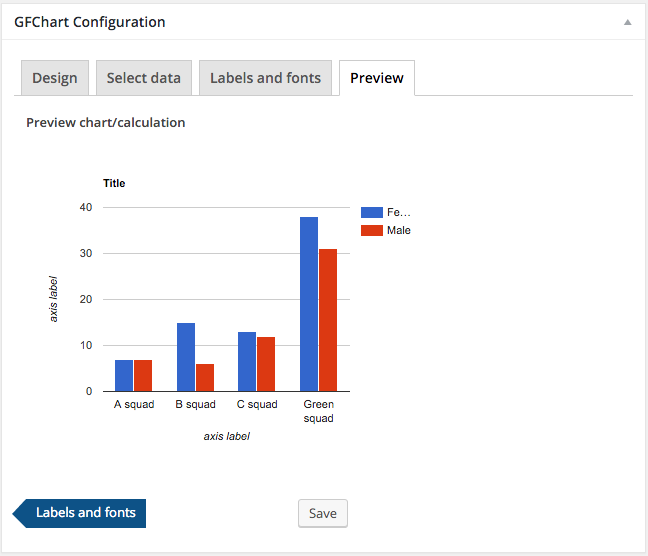
Once these selections have been made press ‘Preview’. Again, there is no need to press ‘Save’, this button is for use if changes are made in future.
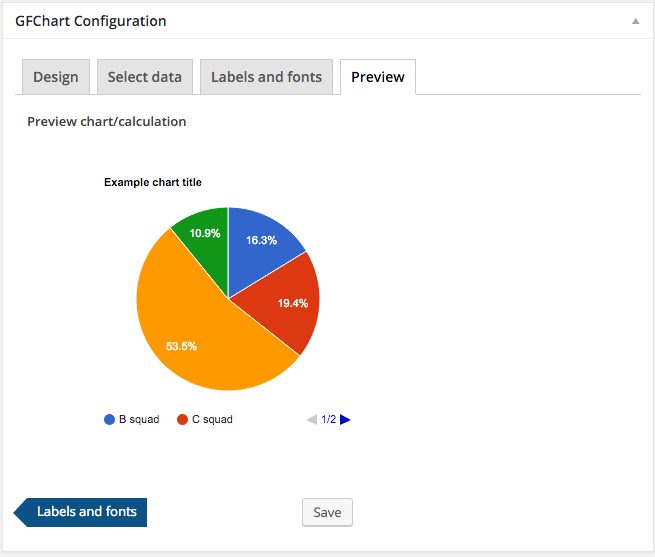
This tab is for previewing purposes only, no input is required. If further edits are required then press on the relevant tab, make the change, press ‘Save’ on that tab, and press on the ‘Preview’ tab again to review the revision. Continue as required until the chart is finished.
Bar Charts
After selecting a Bar chart the ‘Design’ tab will change to this
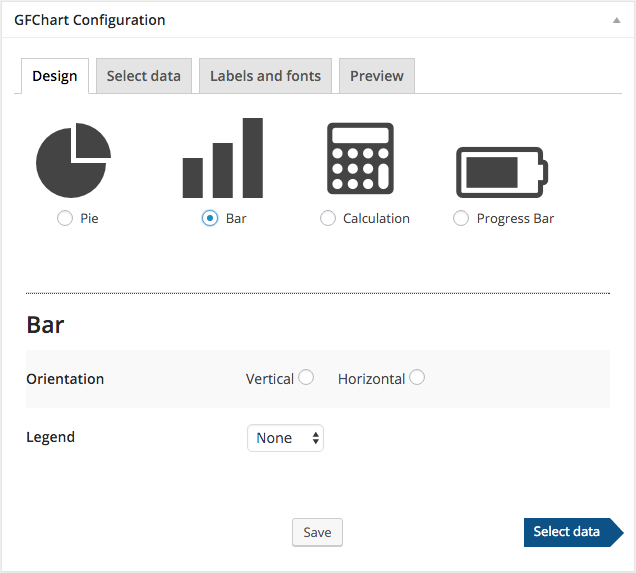
Style options:
- Verical: vertical columns with x-axis on the bottom and y-axis up the side
- Horizontal: horizontal bars with x-axis up the side and y-axis along the bottom
Legend options: None / Bottom / Top / Right / Left / In
Once these selections have been made press ‘Select data’. Note there is no need to press ‘Save’, this button is for use if changes are made in future.
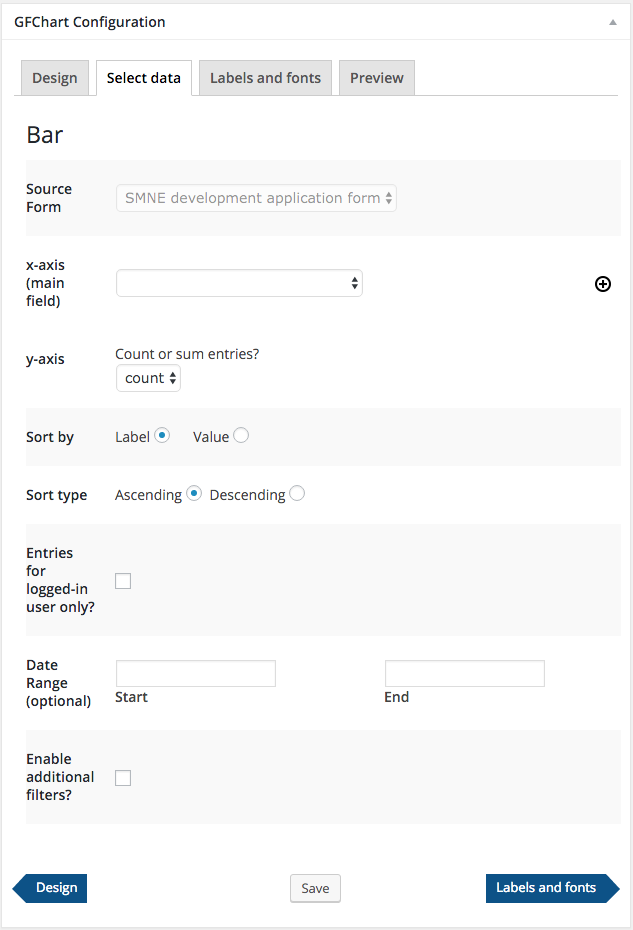
Source Form: this field was already set when the chart was first created and cannot be edited.
x-axis (main field): select the data field to plot.
(+): button to optionally segment the x-axis
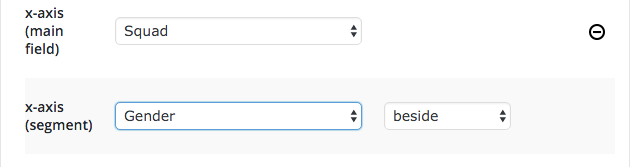
x-axis (segment): select the data field to segment the main field e.g. visitors (main field) can be segmented into male and female. Note that re-ordering of segments is not possible.
- beside: the main data is split into separate segmented bars, placed side by side along the axis.
- stack absolute: the main data remains as a single bar, but with each segment appearing in a different colour.
- stack percent: the main data remains as a single bar representing 100% of that data set. This 100% bar is segmented according to the % share. Each bar works like a mini rectangular pie chart. Ideal for surveys.
Note: Bar chart segmentation is not possible with Gravity Forms advanced survey fields (a graph will be produced but not display correctly).
y-axis: Count or Sum entries is explained here.
Field to sum (if different from x-axis main field): This menu only appears if ‘sum’ is selected above.
Select the field to sum. This should be a numeric value, either stored in a Gravity Forms text or numeric field. Leave this field blank if you are summing the field set as the x-axis default. Leaving it blank will probably only be useful if it is a product field (that contains both a label and number).
When building forms we recommend using numeric fields for numbers because it is then possible to use them as inputs into the Gravity Forms math calculations function. That can then be plotted during GFChart. (Use case example: sales person submits the sales transaction value, GFChart displays their total commission).
Sort by:
- Label: alphanumeric ordering
- Value: height ordering
Sort type: (for the above sorting method)
- Ascending
- Descending
Show zero values? (unsegmented data only): check this box to display columns for which there is no data. (Ideal for surveys where you want to display the full range of options, not just those actually selected). This option does not work for data displayed segmented and stacked.
Entries for logged-in user only: check this box to display entries for only the logged in user (ideal for personal quiz results).
Payment status: this is an optional filter. To activate the filter insert the text generated by your particular payment gateway. For information on how to identify the text, see here.
Date range: this is an optional filter.
Enable additional filters: check this box to trigger additional filtering.
Once these selections have been made press ‘Labels and fonts’. Again, there is no need to press ‘Save’, this button is for use if changes are made in future.
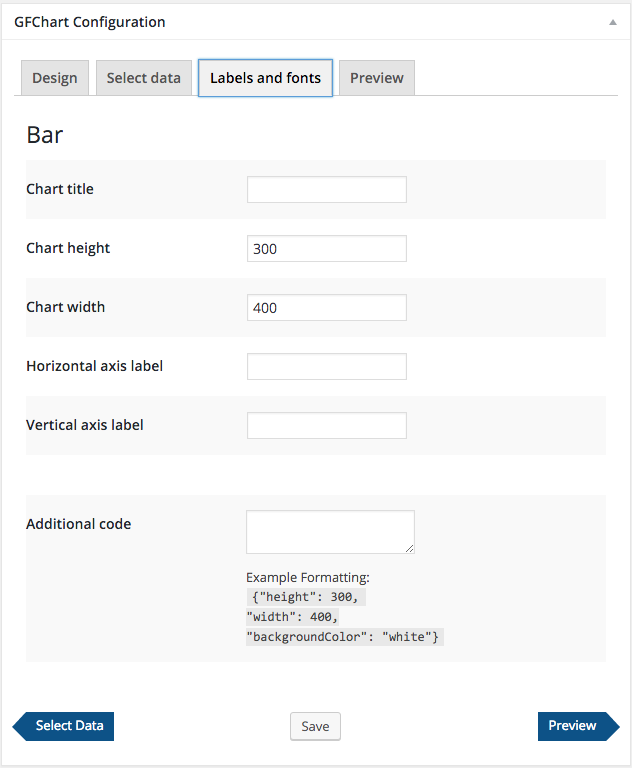
Chart title: insert the text that will be published above the bar chart.
Chart height: in pixels
Chart width: in pixels
Horizontal axis label: insert the text that will be published below the horizontal axis.
Vertical axis label: insert the text that will be published beside the vertical axis.
Responsive: (available from v1.10.0) check for screen size responsiveness. This is switched off by default because it will affect existing charts.
Additional code: This can be used to change colours, fonts etc. Leave blank by default. Usage instructions appear below.
Once these selections have been made press ‘Preview’. Again, there is no need to press ‘Save’, this button is for use if changes are made in future.
This tab is for previewing purposes only, no input is required. If further edits are required then press on the relevant tab, make the change, press ‘Save’ on that tab, and press on the ‘Preview’ tab again to review the revision. Continue as required until the chart is finished.
Calculations
Calculations are not charts, yet they are built and published in a very similar way. They are displayed as simple html text.
After selecting a Calculation the ‘Design’ tab will change to this
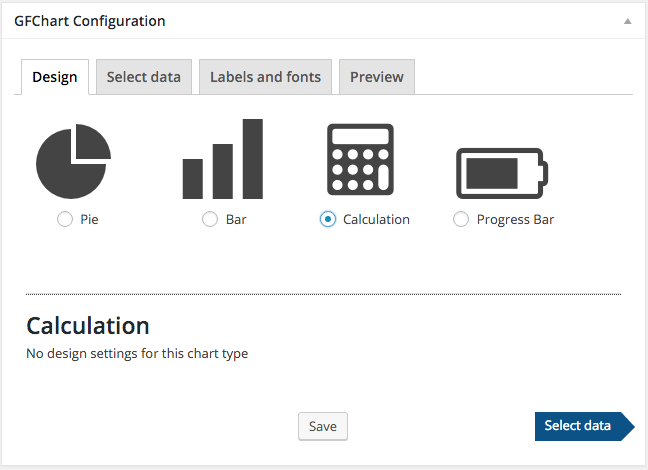
There are no design settings so press ‘Select data’.
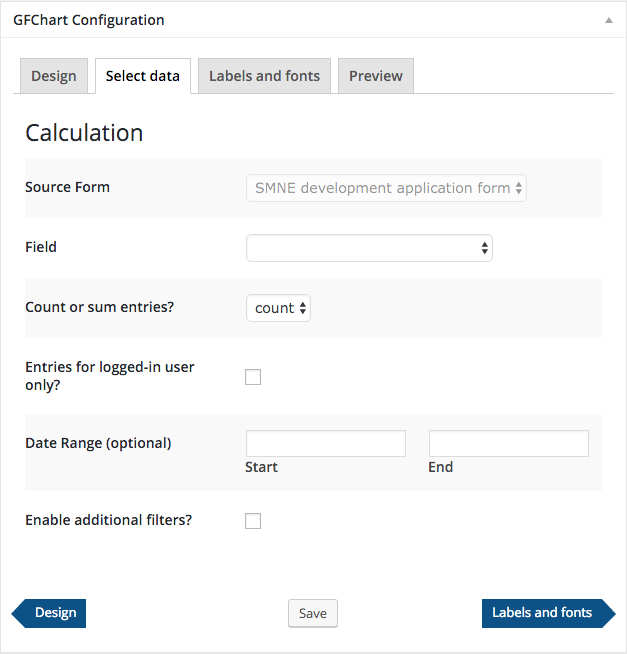
Source Form: this field was already set when the chart was first created and cannot be edited.
Field: select the data field to plot.
Count / sum / average / unique values: explained here.
Entries for logged-in user only: check this box to display entries for only the logged in user (ideal for personal quiz results).
Payment status: this is an optional filter. To activate the filter insert the text generated by your particular payment gateway. For information on how to identify the text, see here.
Date range: this is an optional filter.
Enable additional filters: check this box to trigger additional filtering.
Once these selections have been made press ‘Labels and fonts’. Again, there is no need to press ‘Save’, this button is for use if changes are made in future.
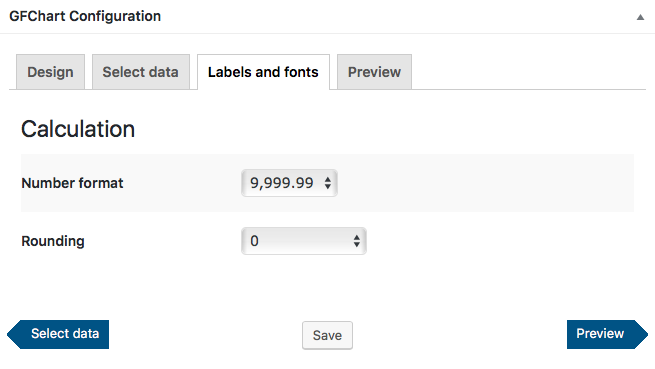
Number format: Currency (set by Gravity Forms settings) / 9,999.99 / 9.999,99
Note: 9,999.99 / 9.999,99 set the thousands and decimal separator only. They do not change the number of decimal places displayed.
Rounding: 0 / 1 / 2 / 3 / 4 / Do not round
Note: if you are connecting this calculation to a Progress Bar then set this to 0 / 1 / 2. Other values will cause the Progress Bar to show zero.
Once selections have been made press ‘Preview’.
Some further formatting of the calculation can be made using standard CSS in WordPress once it has been inserted.
This tab is for previewing purposes only, no input is required. If further edits are required then press on the relevant tab, make the change, press ‘Save’ on that tab, and press on the ‘Preview’ tab again to review the revision. Continue as required until the chart is finished.
Progress Bars
Building Progress Bars is very similar to building other charts, with one significant exception. A calculation must first be built, then the progress bar is based on this calculation. Hence, to build a progress bar, first build a calculation, then follow the instructions below.
After selecting a Progress Bar the ‘Design’ tab will change to this
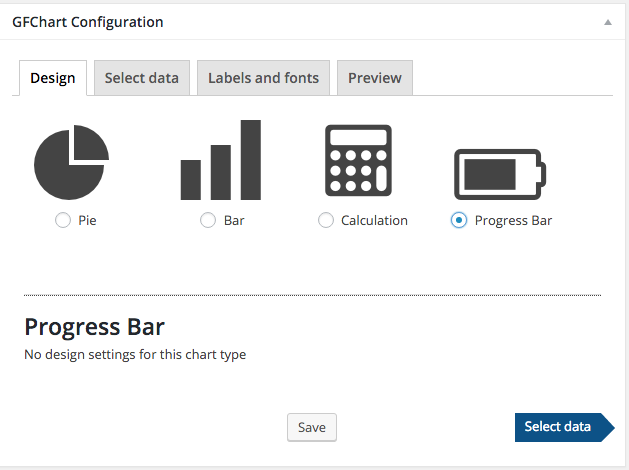
There are no design settings so press ‘Select data’.
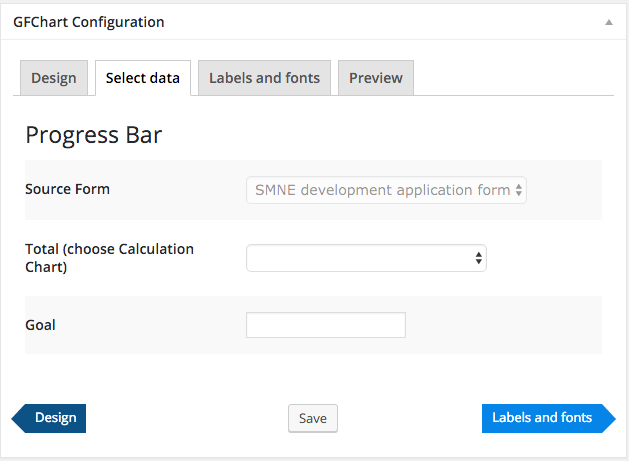
Source Form: this field was already set when the chart was first created and cannot be edited.
Total: select the calculation that the progress bar will monitor.
Goal: insert the numeric 100% target.
Once these selections have been made press ‘Labels and fonts’. Again, there is no need to press ‘Save’, this button is for use if changes are made in future.
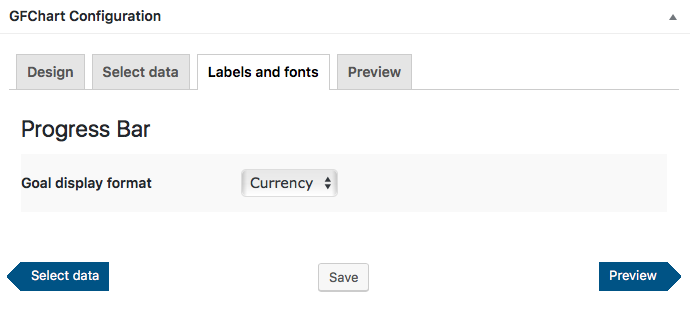
Goal display format: same meanings as in the calculation settings above.
Note it is currently not possible to change the colour or other formatting of the progress bar, unless you use standard CSS.
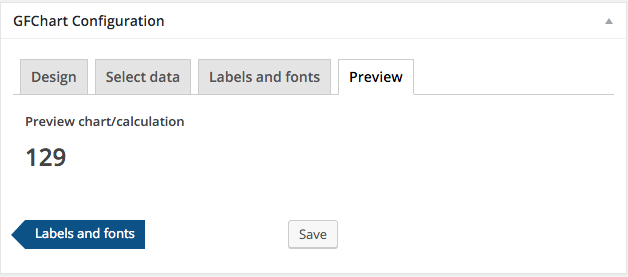
Once these selections have been made press ‘Preview’. Again, there is no need to press ‘Save’, this button is for use if changes are made in future.
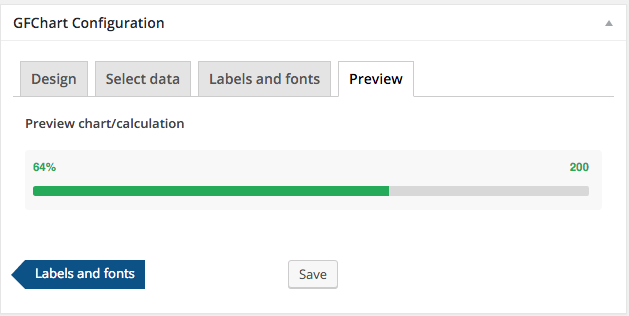
This tab is for previewing purposes only, no input is required. If further edits are required then press on the relevant tab, make the change, press ‘Save’ on that tab, and press on the ‘Preview’ tab again to review the revision. Continue as required until the chart is finished.
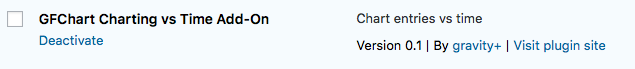
Chart vs Time
Charting against time requires our Charting vs Time Add-On which is available as part of our premium GFChart All package. This plugin must first be installed and activated.
Plugin details are here.
After selecting a ‘vs Time’ chart the ‘Design’ tab will change to this
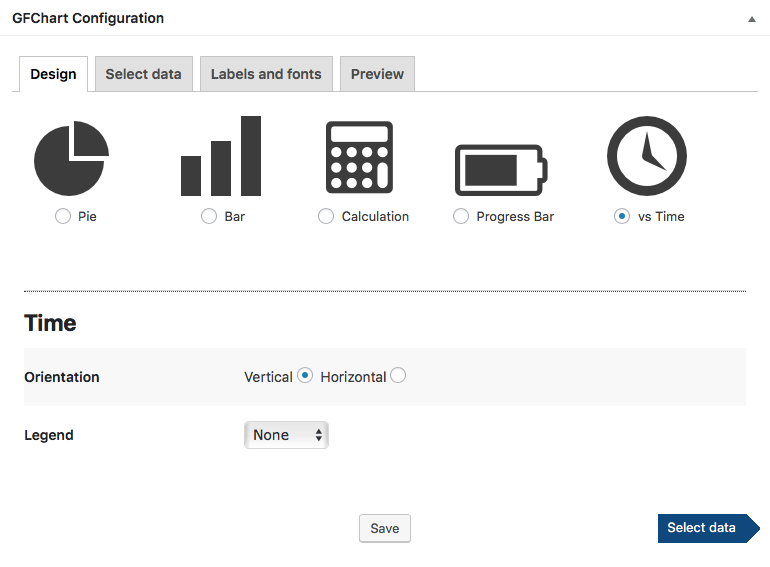
Style options:
- Verical: vertical columns with x-axis on the bottom and y-axis up the side
- Horizontal: horizontal bars with x-axis up the side and y-axis along the bottom
Legend options: None / Bottom / Top / Right / Left / In – this option works but is effectively redundant because only 1 data series can be displayed.
Once these selections have been made press ‘Select data’. Note there is no need to press ‘Save’, this button is for use if changes are made in future.
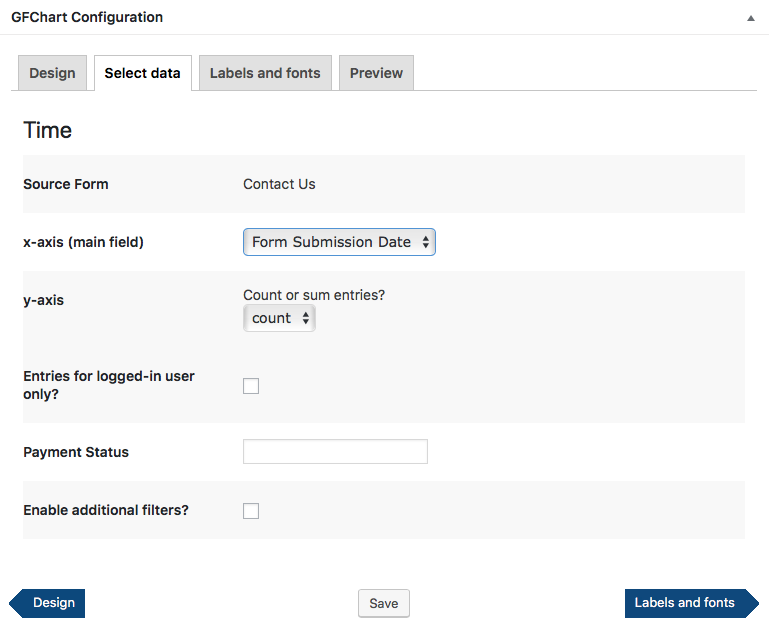
Source Form: this field was already set when the chart was first created and cannot be edited.
x-axis (main field): form submission date or a date field within the form.
y-axis: Count or Sum entries is explained here.
Field to sum (if different from x-axis main field): This menu only appears if ‘sum’ is selected above.
Select the field to sum. This should be a numeric value, either stored in a Gravity Forms text or numeric field. Leave this field blank if you are summing the field set as the x-axis default. Leaving it blank will probably only be useful if it is a product field (that contains both a label and number).
When building forms we recommend using numeric fields for numbers because it is then possible to use them as inputs into the Gravity Forms math calculations function. That can then be plotted during GFChart. (Use case example: sales person submits the sales transaction value, GFChart displays their total commission).
Entries for logged-in user only: check this box to display entries for only the logged in user.
Payment status: this is an optional filter. To activate the filter insert the text generated by your particular payment gateway. For information on how to identify the text, see here.
Enable additional filters: check this box to trigger additional filtering.
Once these selections have been made press ‘Labels and fonts’. Again, there is no need to press ‘Save’, this button is for use if changes are made in future.

Chart title: insert the text that will be published above the bar chart.
Chart height: in pixels
Chart width: in pixels
Horizontal axis label: insert the text that will be published below the horizontal axis.
Vertical axis label: insert the text that will be published beside the vertical axis.
Responsive: (available from v1.10.0) check for screen size responsiveness. This is switched off by default because it will affect existing charts.
Additional code: This can be used to reduce the time period displayed or change colours, fonts etc. Leave blank by default. Usage instructions appear below.
Once these selections have been made press ‘Preview’. Again, there is no need to press ‘Save’, this button is for use if changes are made in future.
This tab is for previewing purposes only, no input is required. If further edits are required then press on the relevant tab, make the change, press ‘Save’ on that tab, and press on the ‘Preview’ tab again to review the revision. Continue as required until the chart is finished.
Text
Displaying free text fields requires our Text Add-On which is available as part of our premium GFChart All package. This plugin must first be installed and activated.
Plugin details are here.
After selecting a ‘Text’ chart the ‘Design’ tab will change to this:
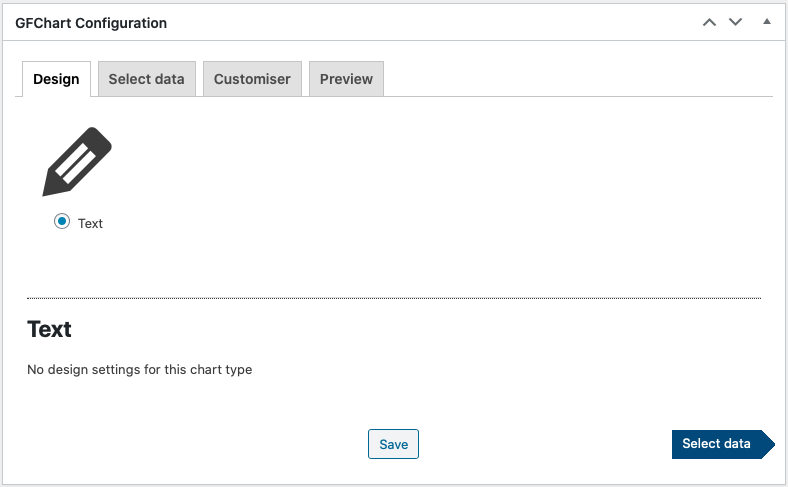
There are no design settings for this chart type so press ‘Select data’:
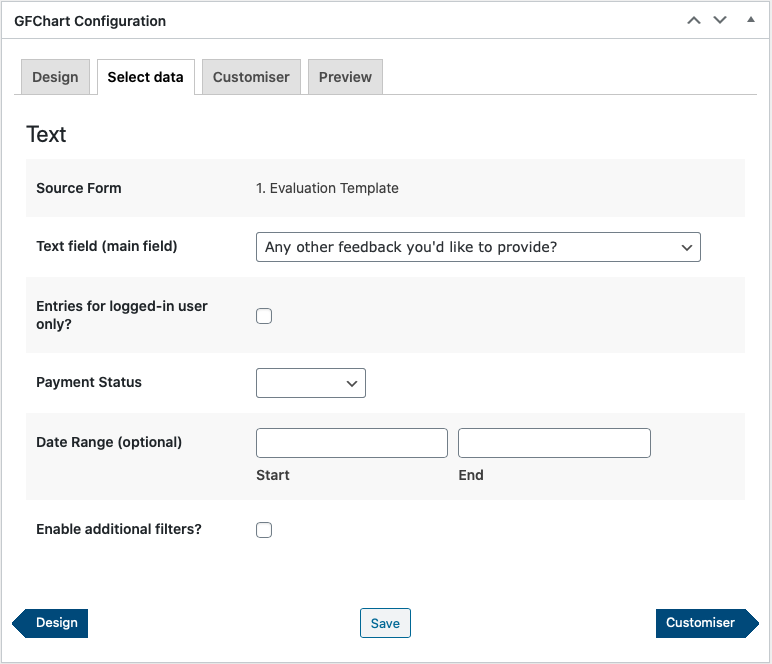
Source Form cannot be changed.
Text field: use the drop down to select single line or paragraph text field(s) within your Gravity Form.
Other other options within this tab are the same as for other chart types.
Entries are displayed in submission order, with the most recent at the top. This cannot be changed.
Press ‘Customiser’:
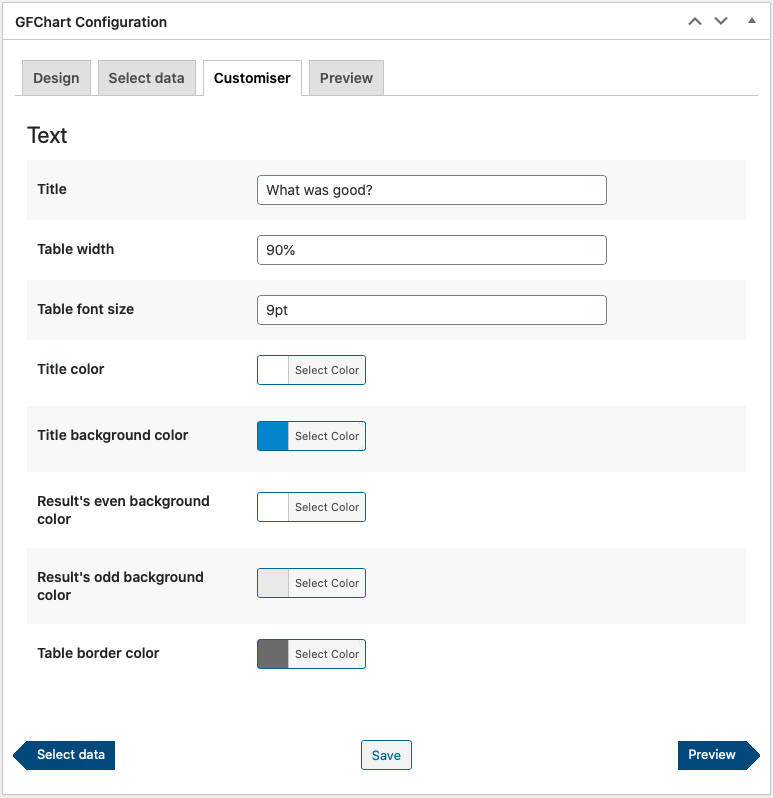
Table width: 100% by default.
Table font size: 1rem (16px) by default.
Note that further table formatting can be achieved using targeted CSS.
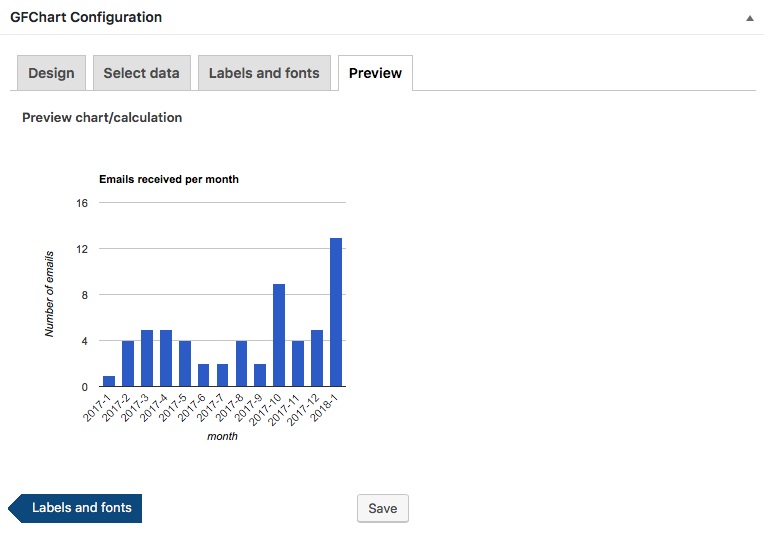
Press ‘Preview’:
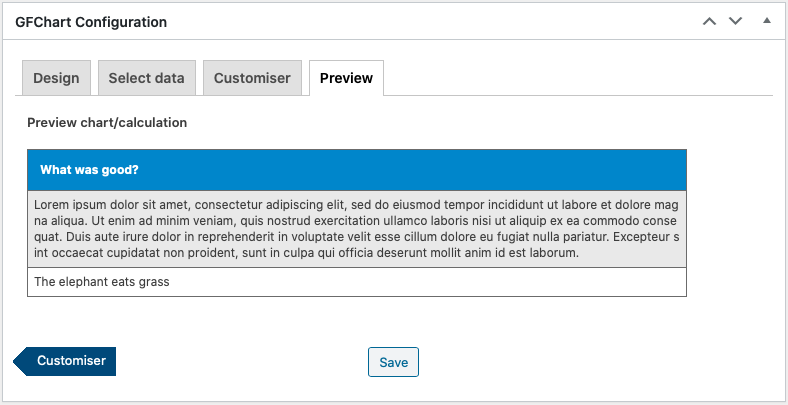
This tab is for previewing purposes only, no input is required. If further edits are required then press on the relevant tab, make the change, press ‘Save’ on that tab, and press on the ‘Preview’ tab again to review the revision. Continue as required until the table is finished.
3. Publish
To publish on a page or post
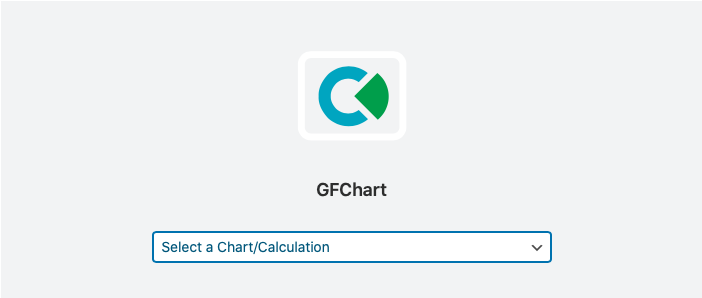
Press the plus button and search for the ‘Chart’ block either through scrolling or text search.
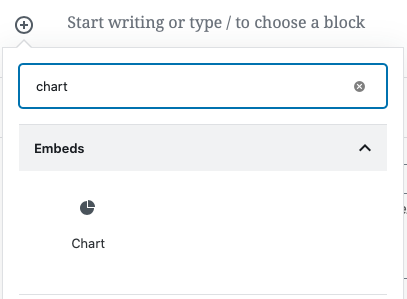
Select the desired Chart/Calculation using the drop down within the block.
Save draft / Preview / Publish the page.
Congratulations – you’re done!
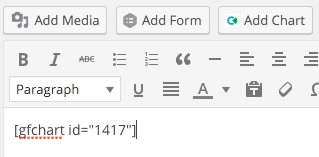
To publish on a page or post using the Classic editor
Position the cursor at the position to insert then press the ‘Add Chart’ button.
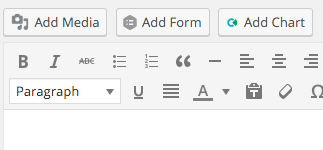
Select your Chart/Calculation, and press ‘Insert Chart/Calculation’.

Shortcode is inserted. Press ‘Update’.
Congratulations – you’re done!
To publish on a widget
Cut and paste the shortcode from the ‘Forms > Charts/Calculations’ page into the widget.
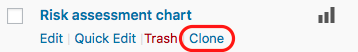
4. Clone / duplicate an existing chart / calculation
Navigate to ‘Forms > Charts / Calculations’
Under the Chart / Calculation that you wish to clone, press the ‘Clone’ button
More details
Relative date filtering

The “Start” and “End” fields in the Date Range filter allow you to enter relative dates. The values must be compatible with the Relative formats in the strtotime() PHP function.
Start = 00:00:00hrs on the first day in the filter period.
End = 23:59:59hrs on the last day in the filter period. Hence leave this field blank if you want to include all entries since the start date.
Dates and times follow the time zone of your WordPress install (prior to GFChart v2.0.0 they followed UTC).
Some examples:
| Filter for | Start | End |
|---|---|---|
| Entries today (since 00:00hrs) | today |
|
| Entries since 11pm yesterday | yesterday 23:00 |
|
| Entries yesterday only | yesterday |
yesterday |
| Entries over the last 4 days | -4 days |
|
| Entries over the last week | -1 week |
|
| Entries over the last 2 months | -2 months |
|
| Entries since 00:00hrs last Monday | Monday |
|
| Entries last Monday only (00:00-23:59hrs) | Monday |
Monday |
| Entries this month | first day of |
|
| Entries this year | first day of January |
|
Dynamic filtering
Dynamic filtering via the shortcode is available using the following structure. [Remember to place within square brackets]:
gfchart id="AAA" filter_field="XX" filter_condition="YY" filter_value="ZZ"
where:
AAA = GFChart id
XX = Gravity Forms field ID
YY = Filter condition (is/isnot/contains/greaterthan/lessthan)
ZZ = Filter value
Export and Import Charts/Calculations
Charts and Calculation export / import capability was introduced with v1.3.0.
- Ensure both the export and import WordPress installs are running GFChart v1.3.0 or higher.
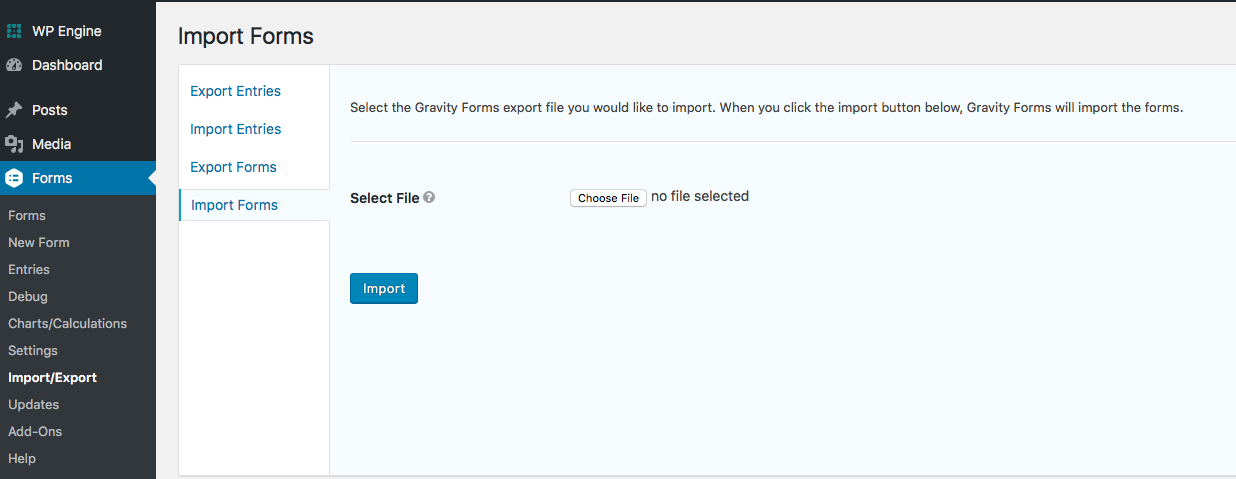
- Use the standard Gravity Forms facilities to export and import the desired form. Any charts/calculations associated with that form will automatically be exported and imported alongside the form. No additional settings or configuration is required. (Find these functions under ‘Forms > Import/Export’). Please ensure that you import the file as a .json not .zip.
- Remember that entries cannot be imported (unless you use the Gravity Forms Import Entries plugin from GravityView). Hence new entries must be created for the imported form before charts/calculations will be displayed.
Count, sum and average explained
- Count: a simple count of the number of form entries. For example, a count of forms received.
- Sum: mathematical addition. For example, the sum of numbers on forms received.
- Avg (Average): the mathematical mean = sum / count.
- Unique values: the number of unique values (generally of a string).
Examples:
- Sales forms: Count will show the units sold. Sum will show the revenue. Average will show the average sale value.
- Order forms (where one form can contain multiple orders): Count will show forms received. Sum will show total orders. Average will show the average order value.
- Donation forms: Count will show number of responses. Sum will show amount raised. Average will show the average amount raised per response.
- Booking forms: Unique values can be used to display the number of cities / states / countries / clubs etc that bookings have been received from. For example if you receive 30 from Florida, 20 from California, and 10 from New York; the unique value count of States will be 3.
How to change colors, fonts, axes, etc
The ‘Customiser’ tab contains an ‘Additional Code’ box (except for Progress charts). This can be used to inject additional formatting instructions into the Google Charts options function. Checkout the Google Charts reference documentation for more information about the potential use of this feature. Note, not all functions appear to work, additional quotes must be added, and cascade by using commas. GFChart does not currently use ‘material’ charts.
These have been successfully tested with GFChart:
| Change | Code example |
|---|---|
| Colours of columns or slices | {"colors": ["#xxxxxx", "#xxxxxx", "#xxxxxx", etc... ]} |
| Colour of background | {"backgroundColor": "#xxxxxx"} |
| Font | {"fontName": "Times","fontSize": 20} |
| Pie font color | {"pieSliceTextStyle":{"color":"red"}} |
| Pie chart angle offset (degrees) | {"pieStartAngle": 90} |
| Pie chart slice visibility threshold | {"sliceVisibilityThreshold": 0.007} |
| Pie chart segment label type | {"pieSliceText":"value"} alternatives are percentage / value / label / none |
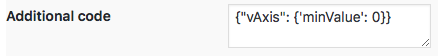
| Force axis to start at zero | {"vAxis": {"minValue": 0}} |
| Bar chart force axis to stop at 8th bar | {"hAxis": {"viewWindow": {"max": 8}}} |
| Bar chart force axis to start at 6th bar | {"hAxis": {"viewWindow": {"min": 6}}} |
| Apply logarithmic scale to vertical axis | {"vAxis": { "logScale": "true" }} |
| Reverse horizontal axis direction | {"hAxis" : {"direction" : -1}} |
| Various modifications to the vertical axis* | {"vAxis" : {"minValue" : 0 , "maxValue" : 10 , "gridlines" : {"count" : 6} , "title" : "Score"}} |
| Set the horizontal axis increments to whole numbers | {"hAxis" : {"format" : "#"}} |
| Set the vertical axis to display in % | {"vAxis" : {"format" : "percent"}} |
| Line chart display data points | {"pointSize": 5} |
| Line chart display cross hairs and data points | {"pointSize": 3 , "crosshair": { "trigger": "both" }} |
| Line chart smooth curve | {"curveType": "function"} |
| Line chart various of the above combined | {"hAxis": {"viewWindow": {"min": 6}}, "pointSize": 10} |
| Add a Trendline (only works with Trend add-on) | {"trendlines": { "0": {} }} |
| Add Explorer capability to pan, zoom etc. (except for Pie charts) | {"explorer": {} } |
| Animate charts (except for Pie charts) | {"animation": {"startup": "true", "duration":500, "easing":"out"}} |
*Note: the ‘Additional Code’ feature can clash with settings elsewhere in the customiser. To overcome this the setting may need to be repeated within the ‘Additional Code’. In this example the axis label (“title”) is repeated in the code.
Thanks to Matt Register and Jared Steckler for their contributions to this.
The colour of the progress bar can be changed using CSS. Thanks to Jesus Mendoza (Colombia) for identifying this solution.
GFChart ALL customers can change the colour and order of columns and slices using the Advanced Customiser.
Payment status filter explained
No filtering = leave this field blank.
Filtering = insert the text for the payment status from your payment gateway used by Gravity Forms.
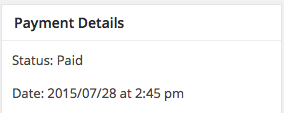
There is no common standard across payment gateways. To find the text we recommend ‘viewing’ an entry within Gravity Forms and looking for the Payment Details information on the right hand side. Here is an example from PayPal standard. In this case filter using the word Paid.
Data set selection
When planning your charts, key design considerations are:
- Single entry being charted
- Multiple form entries being charted
- All users data being charted
- A single user’s data being charted
| Single Entry | Multiple Entries | |
|---|---|---|
| All users | not a practical use case | eg: mass market survey. Use: GFChart BASIC |
| Single user | eg: personal assessment quiz. Use: GFChart ALL including our GravityView add-on. GravityView (purchase separately) also required. Tutorial here. |
eg: single user’s submissions into a larger survey. Use: GFChart BASIC. Utilise the ‘Entries for logged in user only?’ filter within the ‘select data’ tab. |
How to build your survey to swiftly expose powerful insights
Busy, busy, oh so busy.
“Just ship it, we can fix up issues later”.
Our helpdesk is regularly supporting customers that have done this.
Typical scenario: a survey was built using Gravity Forms, and they are now struggling to analyse the response trends.
With surveys we recommend listening to the management guru Stephen R. Covey:
Begin with the end in mind
Even a few minutes planning ahead can save literally hours later. Here are our top tips:
What are you hoping to do differently once you get the survey results?
It’s very easy to ask questions. Not so easy to select questions that will give powerful insights.
“How satisfied are you?” is an obvious question, but it’s answer often isn’t helpful. Knowing that most people are satisfied is reassuring, but little more. Much more powerful is knowing the trend – are we improving, between locations, between customer types, etc?
Use Gravity Forms!
Gravity Forms is an extremely versatile tool to collect all sorts of information – perfect for building surveys!
Keep it simple
There are many exciting field types that you could use, but why? Complexity may distract, confuse, or simply not display well on some devices.
In particular be careful about using some advanced Gravity Forms fields. Their underlying data structure can be more complex and not always compatible with GFChart and other data analysis tools.
Minimise use of free text fields
Free text fields are fantastic because respondents use their own language and agenda. Responses can be rich and powerful.
They are imperative for surveys but minimise their use. Respondents won’t be bothered to fill in many of these, and they are difficult to analyse for trends.
Use drop-downs (not free text) for standard selections
This will eliminate spelling and formatting differences to enable effortless analysis.
e.g. “X Swim Club” and “x swimming club” refer to the same club but require time consuming data cleansing to be automatically recognised as the same.
Use drop-downs or radio buttons for exclusive alternatives
e.g. tea / coffee. Results display well on a pie chart.
Further segmentation can be displayed on a bar chart.
For a spectrum of responses, consider a bar chart. Top tip: number each response to ensure chart column display order is correct.
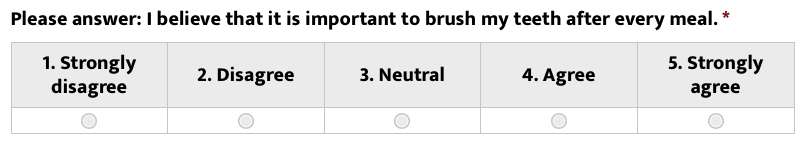
This example features a ‘Likert’ survey field single row. Please note that GFChart is not compatible with this field set to ‘multi-row’.
Use check-boxes (not multi-select) for listing all preferences
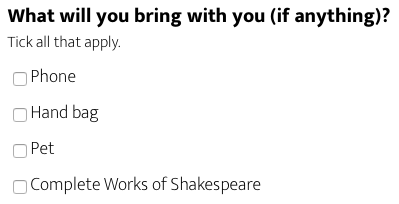
Results display well in a bar chart. Ranked by popularity if necessary.
(Multi-select works just fine, it’s just more fiddly for some users to complete).
Don’t use PHP relevant or special characters
If you are using GFChart do not use quotes, commas or brackets. See documentation here. Other data analysis solutions may trip over some characters.
Build and test your analysis tool prior to launching the survey
A popular analysis tool is to download data as a csv file and analyse in a spreadsheet. Please test this to ensure that the data format is easy to work with without a PhD in Data Science! If necessary change your field type or configuration to improve ease of data manipulation.
Offline data analysis will give you access to more advanced tools, but it requires manual effort and the analysis will never be completely up to date.
GFChart analysis is automatic and in real time.
Trends can be more significant than absolutes
This chart was produced using the premium GFCharting vs time add-on.
If in doubt, ask us!
Our helpdesk would be delighted to recommend a GFChart solution for your needs. Contact us!
Recipes
Create an events booking system
Build a Booking System for your Event on your WordPress Website using GFChart for Gravity Forms.
When you host an event, you need to find out as much pre-data as you can about the attendee so you can make their experience better at the event.
Somehow you need to engage them, so they are willing to impart that insight into their wants and needs, with you.
What better way than to ask them relevant questions, at the time of booking.
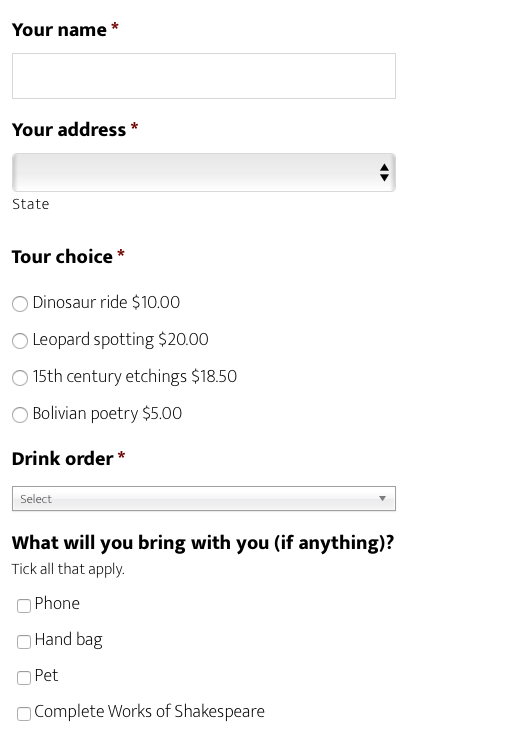
Build a Booking Form which includes some survey questions and that way when you are collecting their personal booking details you can also gain some insight into their expectations or requirements.
Here is a very simple example that we mocked up to show you how to do it in WordPress.
Working Example
What You’ll Need
- WordPress
- Gravity Forms (basic license)
- GFChart Classic
- 20 Minutes
Instructional Video for Event Booking Form
Instructional Video for GFChart Event Booking Report
Don’t have GFChart yet or need to upgrade to more features?
Create a sales report from event bookings form
Looks like
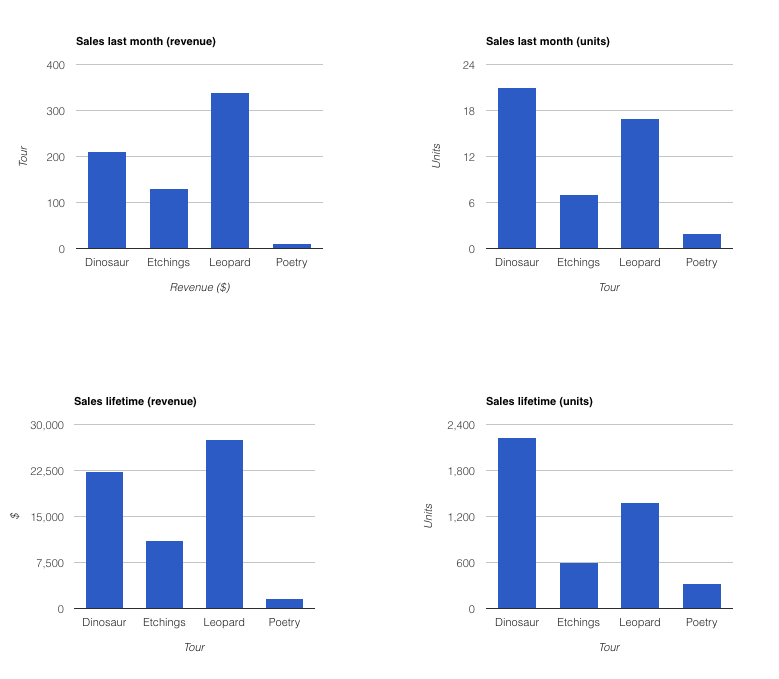
Working example
https://gfchart.com/sample-output (top 4 charts only)
Ingredients
- WordPress
- Gravity Forms (Basic license)
- GFChart (any license type)
Time required
2 minutes per chart.
Instructional video
Build a WordPress Assessment Quiz
We have recently created a new tutorial for this here. The documentation below will be retired shortly.
Here we explain how to build a WordPress Assessment Quiz. These are commonly used for personality style assessments. See working example here.
It is built using:
- Gravity Forms for the assessment form.
- GravityView to display the results for the single form entry. Optionally it can also be used to limit users to seeing only their own entries.
- GFChart with the GFChart GravityView add-on to chart results for a single entry.
1. Preparation
- Install and activate Gravity Forms (affiliate link, purchase separately).
- Install and activate GravityView (affiliate link, purchase separately). If you want to limit users to seeing only their own entries, then purchase a version including the Advanced Filter Extension (currently part of the GravityView ‘Interstellar’ package).
- Install and activate the GravityView Advanced Filter Extension (if you want to limit users to seeing only their own entries).
- Install and activate GFChart.
- Install and activate the GFChart GravityView add on (available as part of the GFChart ‘All’ package).
2. Create the Personal Profile Assessment Form
You may create your own but we recommend that, initially at least, you use ours as a quick and easy way of getting started.
The filename is GFChart_Sample_Personal_AssessmentForm.json. You should download this from your account page. If necessary unzip into .json format before importing into Gravity Forms.
Import via: ‘Forms’ > ‘Import/Export’ > ‘Import Forms’ > ‘Chose File’.
3. Create a Page for this Assessment form
Create and publish new page within WordPress and insert the above Gravity Form into it.
4. Create the View
If you are not familiar with GravityView then here is some introductory context: GravityView can display lists of entries, which are configured using the Multiple Entry View tab; and single entries, using the Single Entry View tab. Within the Multiple Entry View you can create a link to the Single Entry View.
Even if you only want to display a single entry, we recommend that you configure both multiple and single entry views. This will allow a user to see all entries that they have created, including you as the developer configuring this assessment.
OK so let’s now create the View…
A. ‘Views’ > ‘New View’
B. Give it a name
C. Select the Gravity Form imported above
D. Select ‘List View’
E. Under ‘View Configuration’ under the ‘Multiple Entries’ tab, go down to the ‘Entries Fields’, in ‘Listing Title’ press ‘+ Add Field’. Select ‘Unique Survey Label’ (which is the field name in the form). Press on the cog and select ‘link to single entry’. ‘Close’ then ‘Publish’.
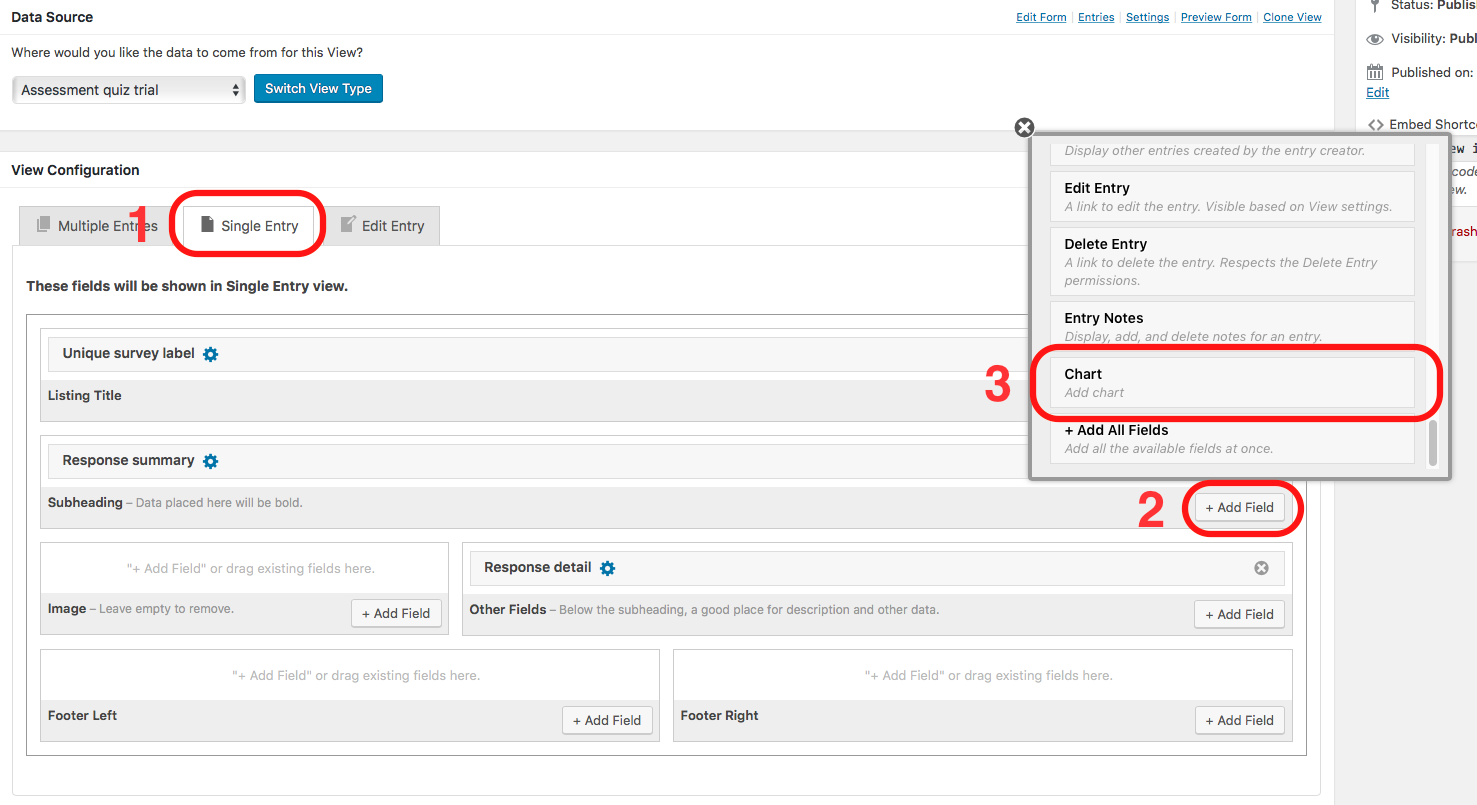
F. Now select the ‘Single Entry’ tab, in ‘Listing Title’ press ‘+ Add Field’ and select ‘Unique Survey Label’ (we are using this again as the title of the single entry page).
G. Under ‘Subheading’ press ‘+ Add Field’ and scroll down and select ‘Chart’. (Note this Chart option will only appear if the View has been published as specified in E above). Then press on the cog. Configure as shown here:
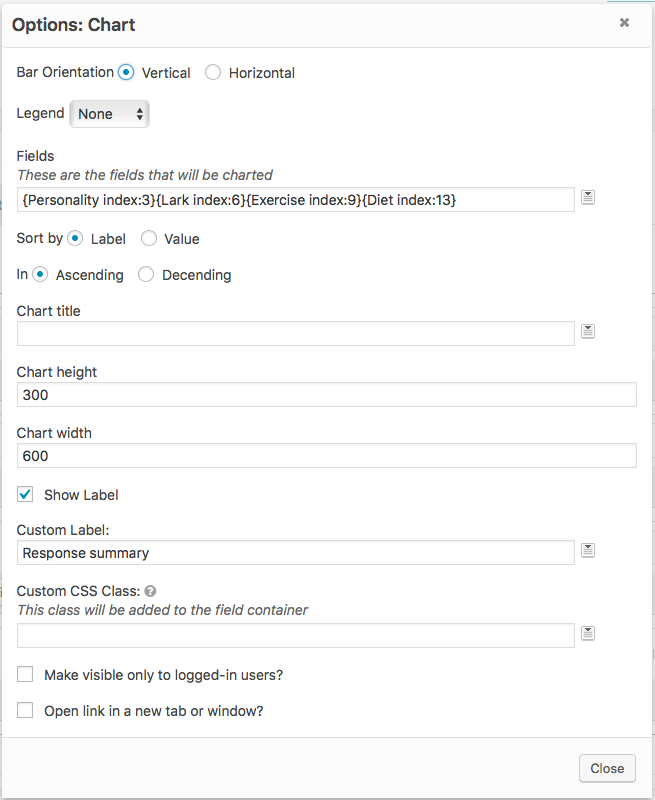
H. Under ‘Other fields’ press ‘+ Add Field’ and select ‘Custom Content’
Configure as shown here:

Zoom in on the html content:

Download it here.
J. If you want to limit users to seeing only their own entries, then follow these instructions from GravityView.
I. ‘Update’ and copy the shortcode. This will look something like:
5. Create a Page for the Assessment Results
Create and publish a new page within WordPress (note this is different from the form page created in 3 above). Insert the GravityView shortcode from I above. Update. Copy the page url.
6. Set the Assessment Form redirect to the Assessment Results page
When someone submits an assessment you want it to automatically redirect to their results. Set this up by:
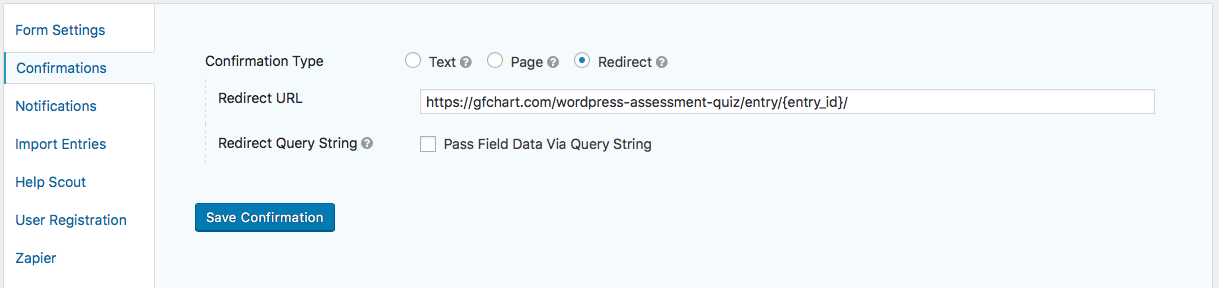
Edit the ‘confirmations’ settings within the Gravity Form. The ‘confirmation type’ should be set as ‘Redirect’ and the format should be built from the url copied in 5 above and have the following format: http://yoururl.com/your-results-page/entry/{entry_id}/
Example:
7. Test!
Navigate to the page containing the Assessment Form. Complete the form, submit, and you should automatically divert to a the results page showing a chart of the results.
Common issues
Updates not appearing on the WordPress plugin dashboard
Please verify that your license is valid, entered correctly under ‘Forms > Settings > GFChart’, and activated. From v1.0.0 onward the license status will be show by a green tick or red cross.
1-click plugin update error
Failed update – if you experience ‘Update failed: Plugin update failed’ like this:
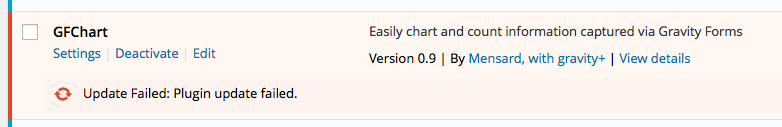
OR
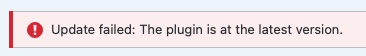
Failed update – ‘Update failed: The plugin is at the latest version’:
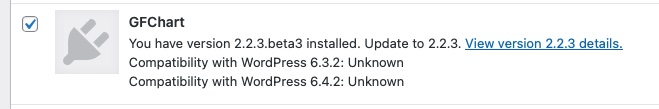
Then navigate to ‘Dashboard > Updates’ check the GFChart box, and trigger the update from there:
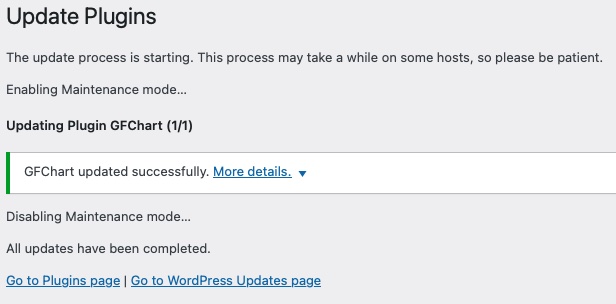
Successful result:
Alternatively, you may login to your account page and manually download and update the plugin on your local site. Note you may delete and re-install the plugin without losing your Chart/Calculations objects.
Other potential issues causing update failures
If your error message says ‘unauthorised’ then the following are more likely:
- Your license has not been activated on the site. Please activate on your site at: ‘Forms > Settings > GFChart’ then insert the license key and press ‘Activate’. The green tick or red cross will indicate status. If there is a red tick and/or you cannot activate the license, please uninstall the plugin using the button on the same page (don’t worry, despite the warning message it won’t remove any settings except for the license key. It doesn’t actually remove the plugin, it simply deactivates it and deletes the license). Then reactivate the plugin on the plugins page. Return to the license page and re-enter the license key and activate.
- Your license has expired. Please check it’s status via the your account page.
Members plugin settings
The Members plugin is a fantastic permissions and content protection solution from Justin Tadlock. It is perfect for protecting pages containing Charts/Calculation. It’s freely available from the WordPress plugin repository.
To ensure trouble free operation alongside GFChart then configure Members as follows:
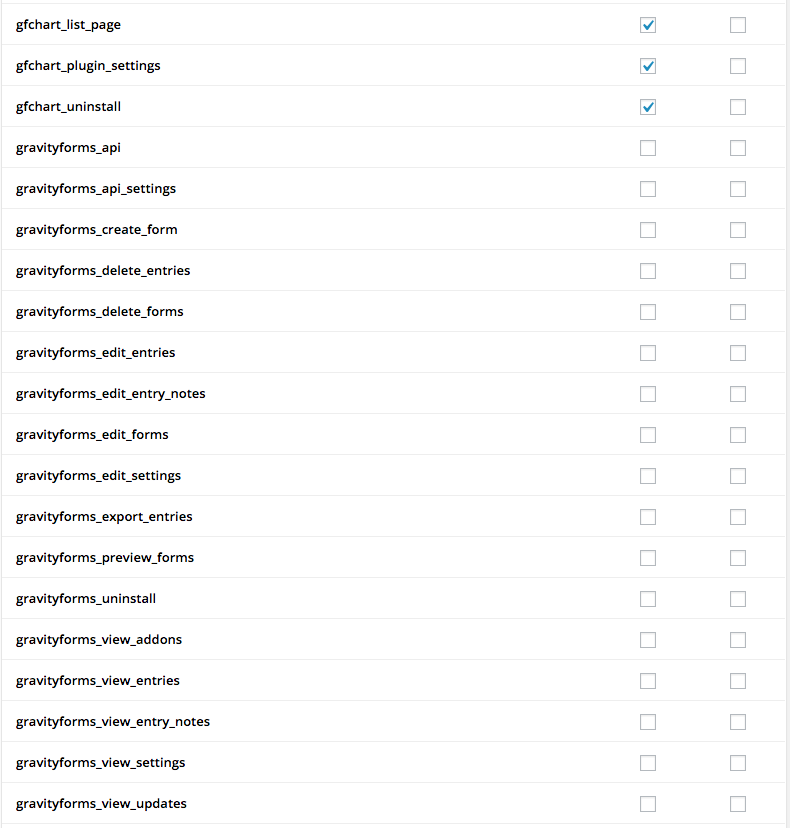
Navigate to ‘Users > Roles > Administrator – Your Role’ and configure the permissions as shown below. Note it is the Gravity Forms settings that are key (it is they that are blocking the GFChart menu from appearing in certain scenarios).
WP Rocket and other accelerator / caching plugin settings
WordPress accelerator and caching plugins, such as WP Rocket, must have ‘JS minimisation’ turned off otherwise the charts will not appear for non-logged in users.
Problems updating license
The GFChart license key interface can be a little fussy so we suggest the following when updating your license key:
1. Navigate to the license key page (Forms>Settings>GFChart)
2. Delete anything that is in the license key box and press ‘deactivate’. There should now be a red cross beside it.
3. Once the box is empty, insert the new license key and press ‘activate’.
Not sure which license key to use, check here?
Charts not appearing
There can be a variety of reasons why charts are not appearing on a page. Our recommended fault finding procedure is:
- Confirm that the chart displays in the ‘preview’ tab in the chart configuration. If it says ‘no data’ then no chart will appear on the page.
- Create a new test page with a title but no content. Insert the shortcode into that new page and see whether it displays. If it does then there was probably some content on the original page that was blocking the chart from displaying.
- If the chart still does not display then it is likely that the chart javascript is not working properly. This can be for a variety of reasons. First of all we recommend clearing the cache in both your browser and your host and see whether that resolves the issue. Also try viewing the page via a different browser.
- Investigate potential sources of javascript issues: do you have any speed accelerator or caching plugins that are limiting javascript execution? Try temporarily disabling those. Do you have any page builder services running that might be interfering in some way (this should not happen, but check any obscure details relating to javascript).
- Investigate plugin and theme conflicts according to the standard procedure.
- Contact our helpdesk, please include the url of the problematic page, and temporary admin login details.
Caution: PHP relevant characters
Field labels or form submissions containing PHP relevant characters can cause issues with legends, additional columns/segments, or incorrect calculations. PHP relevant characters include single and double quotes, various bracket types, commas, semi-colons, etc.
In certain circumstances these characters are interpreted as PHP rather than data. The effect is that GFChart either truncates the data, or separates it into separate entries. This then causes additional or odd legends, columns or segments; or incorrect calculations or filtering.
The workaround is to add a backslash \ immediately before any such characters. If these characters are within fields then this is easy to do retrospectively. If these characters are within form entries then each entry must be edited, sorry!
We recommend against using such characters.
Divi theme
Charts not appearing when using the Divi theme?
The Divi theme had an update in 2021 that added a performance panel. Turn off the ‘dynamic javascript libraries’ to ensure charts display.
Thanks to Dominic Miles for this.
Add-Ons
Charting vs Time Add-On
Summary
The Charting vs Time Add-On allows users to plot data aggregated over time periods. Consider the Trend Add-On to plot non-aggregated data.
Charting vs Time Add-On capabilities:
- Bar Chart (horizontal or vertical).
- Line Chart (vertical).
- Data aggregated by month, for current month and previous 12 months.
- Data aggregated by week, for the current week and previous 25.
- Data aggregated by day, for the current week and previous 30.
- Data is either a count, sum, average, count unique of entries or form conversion %.
- Single data series.
- Date is either form submission date OR date field value.
- Compatible with our Image Charts rendering service.
This add-on is available to premium GFChart All customers.
Pre-requisites
- WordPress v4.3+
- Gravity Forms v1.9+
- GFChart v1.9.0+
Installation
GFChart All customers may download the plugin file from their account page.
Within the WordPress install under ‘Plugins > Add new > Upload > Choose File > Install Now’ then ‘Activate’.
Your GFChart All license key will enable automatic updates for this plugin.
Usage instructions
Version history
v0.11 (11-Jul-22)
- Fix: Day totals attributed to the correct day for charting by day in install time zones west of UTC.
v0.10 (24-Sep-21)
- Fix: Weekly chart calculation and date fix.
- Fix: Calculation based on install time zone (not UTC) for all time intervals.
- Fix: Additional filter checkbox now fully operational in all environments.
v0.9 (21-May-21)
- New: Data displayed by week (current and previous 25), and day (current and previous 30).
- New: Average, Count Unique and Form Conversion % added.
v0.8 (10-Oct-20)
- Fix: Compatibility with GFChart v2.0.0
v0.7 (01-Sep-20)
- Fix: Compatibility with GFChart v1.17.0
v0.6 (22-Apr-20)
- New: Charting against date field introduced
v0.5 (30-Jul-19)
- New: Line charts introduced
v0.4 (19-Jul-19)
- Fix: compatibility with GFChart 1.12.0
v0.2 (08-Mar-18)
- Fix: correct calculation for first month
- Fix: requires GFChart (and avoids WSOD during manual upgrades of GFChart)
v0.1 (24-Jan-18) First release
DIY Bar
Summary
The DIY Bar Add-On allows developers to manually create their own bar charts from GFChart Calculations. It is ideal where various data needs to be displayed on a single chart. It allows data from multiple forms to be combined into a single chart.
DIY Bar Add-On capabilities:
- Bar Chart (horizontal or vertical).
- Plotted value is the value from a GFChart Calculation, from any form on the site. Value is calculated upon page display.
- Bar label is manually configured by the developer.
- No maximum number of bars, subject to display and performance limitations.
- Single value per bar.
This add-on is available to premium GFChart All customers.
Brief user instructions
DIY Bar Chart pulls values from other existing ‘calculation’ GFCharts. The building workflow is:
- Create calculations for the value(s) that you would like to plot in the bar chart.
- Within ‘DIY Bar Chart’ select the appropriate calculation from the ‘value’ drop down field within each bar. Manually type a text label for each bar.
See here for further instructions.
Version history
v0.3 (17-Oct-24) Fix for critical error if plugin checks for updates while Gravity Forms is deactivated or updating.
v0.2 (11-Jul-22) Enabled for Image Charts (with Image Charts v1.0.2).
v0.1 (26-Feb-21) First release.
GravityView Add-On
The GravityView Add-On allows users to:
- produce a bar chart from single entry. This is ideal for personality type assessment tests. A demo is available here.
- chart from multiple entries as shown in GravityView, including its front end filtering function. A demo is available here.
This add-on is available to GFChart All customers.
Installation
GFChart All customers may download the plugin file from their account page.
Within the WordPress install under ‘Plugins > Add new > Upload > Choose File > Install Now’ then ‘Activate’.

Single entry configuration
This add-on adds an additional ‘Chart’ field type within the GravityView ‘Single Entry’ tab, see below. Please note that the user interface is completely different from the GFChart core plugin.
(press on this image to open an enlarged version)
To replicate the Assessment Test on this website
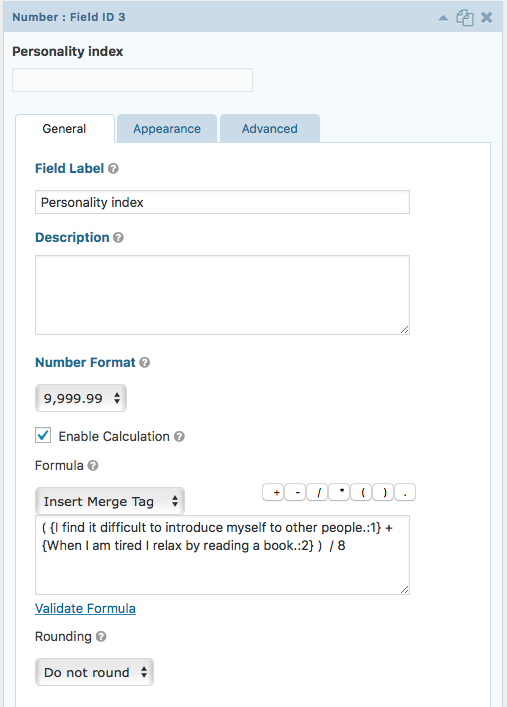
Use the ‘show values’ function with the Gravity Forms Radio Buttons fields.

Add hidden Calculation fields within the form. Configure the Single Entry Chart widget to these calculation fields.
Single entry known current limitations
- Single bar chart only
- Cannot manually scale the axis
- Cannot change colours
- Chart export / import not available within this add-on
Multiple entry configuration
Similar to ‘single entry’ above, an additional ‘Chart’ field type is available within the GravityView ‘Multiple Entry’ tab. Note:
- the ‘view’ must first be published for the ‘chart’ field to appear.
- add the ‘Chart’ field only to Top or Bottom widgets, otherwise you will receive “error while adding the field. Please try again or contact GravityView support”.
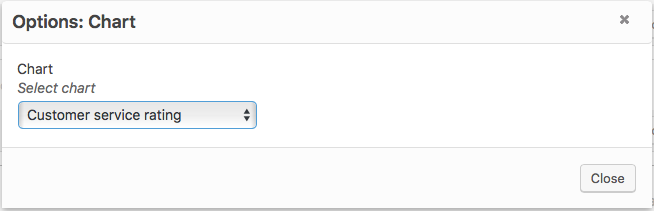
Unlike the ‘single entry’ above, this triggers a simple box from which the relevant chart / calculation can be selected. The chart / calculation should first have been built through the standard GFChart interface.
Note: to guarantee that charts / calculations follow GravityView filtering, they must be published within GravityView using the chart widget described above. We recommend against publishing charts / calculations elsewhere on a page where a GravityView is published because they may not always follow GravityView front end filter settings.
Multiple entry known current limitations
- Compatible with Pie, Bar and Calculations. Not compatible with Charting vs Time. Untested with Text and Trends add-ons.
- Pie Charts from Checkbox fields are not supported.
- Not compatible with GravityView DataTables extension.
Pre-requisites
- WordPress v4.3+
- Gravity Forms v1.9+
- GFChart v1.9.0+
- GravityView v
Version history
v0.10.3 (13-Jul-24)
- New: ‘Additional Code’ box enabled to allow more granular formatting of bar charts.
- Fix: No critical error if Gravity Forms deactivated.
v0.10.1 (21-Apr-24)
- New: Enabled for text charts.
- New: Enabled for multiple bar charts in the same view.
- New: Enabled for Image Charts in single view.
v0.9.1 (03-Mar-21)
- Fix: full backwards compatibility with v0.8 for legacy installs
v0.9 (19-Dec-20)
- New: Radar chart enabled using Chart.js library.
- New: Radar chart values and target values.
- New: More than 1 radar chart in a view.
v0.8 (17-Jul-20)
- Fix: compatibility with latest versions of GravityView and GFChart
v0.7 (22-Apr-20)
- Fix: improved automatic update reliability
v0.6 (18-Dec-19)
- Fix: improved compatibility with GravityView v2.5
v0.5.beta1 (20-Jun-18)
- Fix: improved compatibility with GravityView v2.0
v0.4 (08-Mar-18)
- Fix: requires GFChart (and avoids WSOD during manual upgrades of GFChart)
v0.3 (24-Jan-18)
- Important: Requires GFChart v1.9.0.
- Tweak: Gravity Forms v2.3 compatibility. Is backwards compatible with Gravity Forms v2.2
- New: Automatic update capability for future releases and customers with an updated license key.
v0.2 (23-Dec-16) Adds multiple entry capability.
v0.1 (11-Nov-16) Initial release with basic functionality, limited documentation, and no automatic update capability.
Image Charts
Summary
The Image Charts Add-On enables Charts and Calculations within Gravity Forms notification emails and PDFs.
This add-on is available to all premium GFChart All customers.
For the ultimate in professional PDF reports we recommend you use this in combination with GravityPDF which is available free.
Premium reports are also available from GravityPDF as described here:
Pre-requisites
- WordPress v4.3+
- Gravity Forms v2.3+
- Gravity PDF (only if charts/calculations are to be inserted into a PDF)
- GFChart v1.11.0
- Valid GFChart All license activated on the site
Installation
GFChart All customers may download the plugin file from their account page. The filename is GFChart-image-charts.zip.
Within the WordPress install under ‘Plugins > Add new > Upload > Choose File > Install Now’ then ‘Activate’.

Ensure that your valid ‘GFChart All’ license is activated on the site.
There are no user configurable settings for this add-on. There are no additional menus. It works automatically in the background.
Insert chart or calculation into an email
1. Within Gravity Forms select the Form that the notification relates to.
2. Navigate to ‘Notifications’.
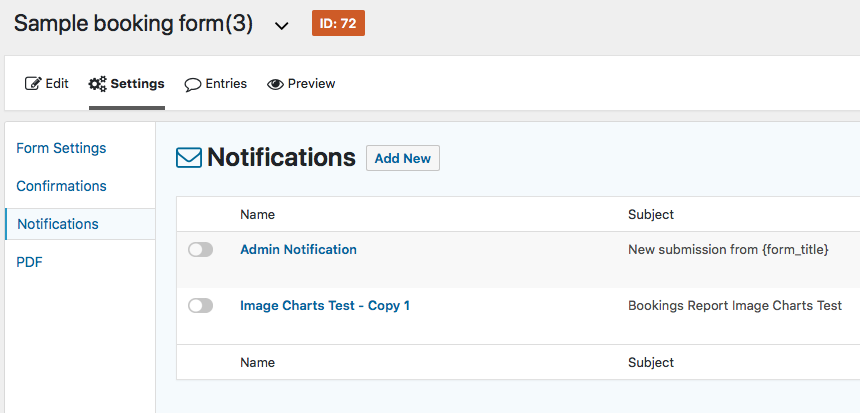
3. Either add a new notification, or edit an existing one.
4. Insert the relevant GFChart shortcode within the ‘Message’ field.
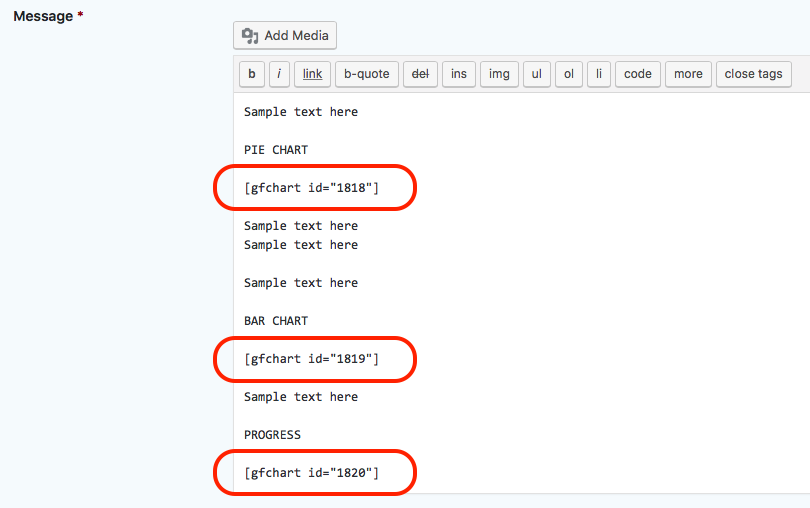
5. Press ‘update notification’.
6. Test.
Insert chart or calculation into a PDF
In summary: insert the relevant GFChart shortcode within the PDF, just like in email notifications. Detailed instructions are being written below right now…..
Firstly, ensure GravityPDF is installed and activated. You can quickly test GFChart Image Charts by simply inserting the normal GFChart shortcode into a PDF header. Achieve this by:
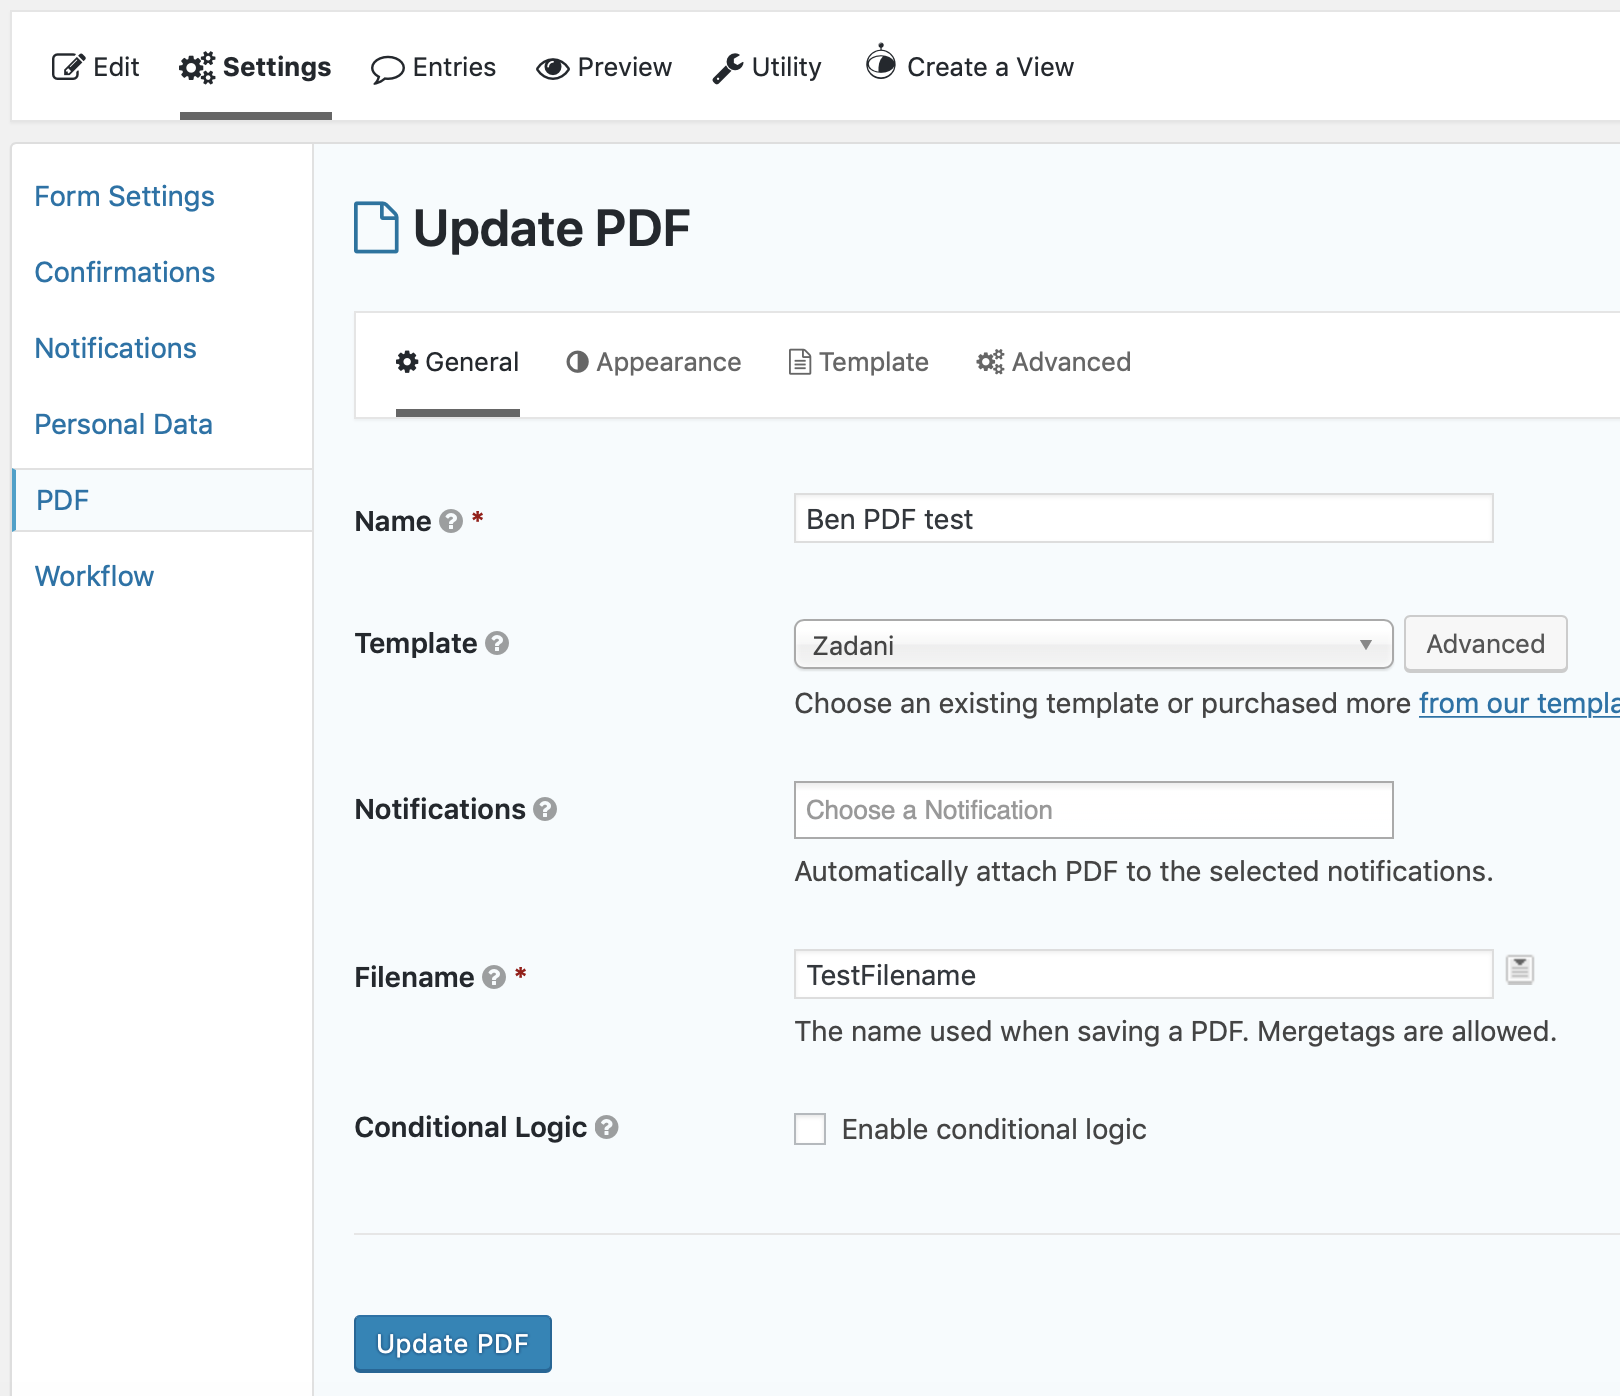
1. Navigate to ‘Settings > PDF’ and press ‘Add New’
2. Give it a name, use the ‘Zadani’ template, and add a filename. Press ‘Add PDF’.
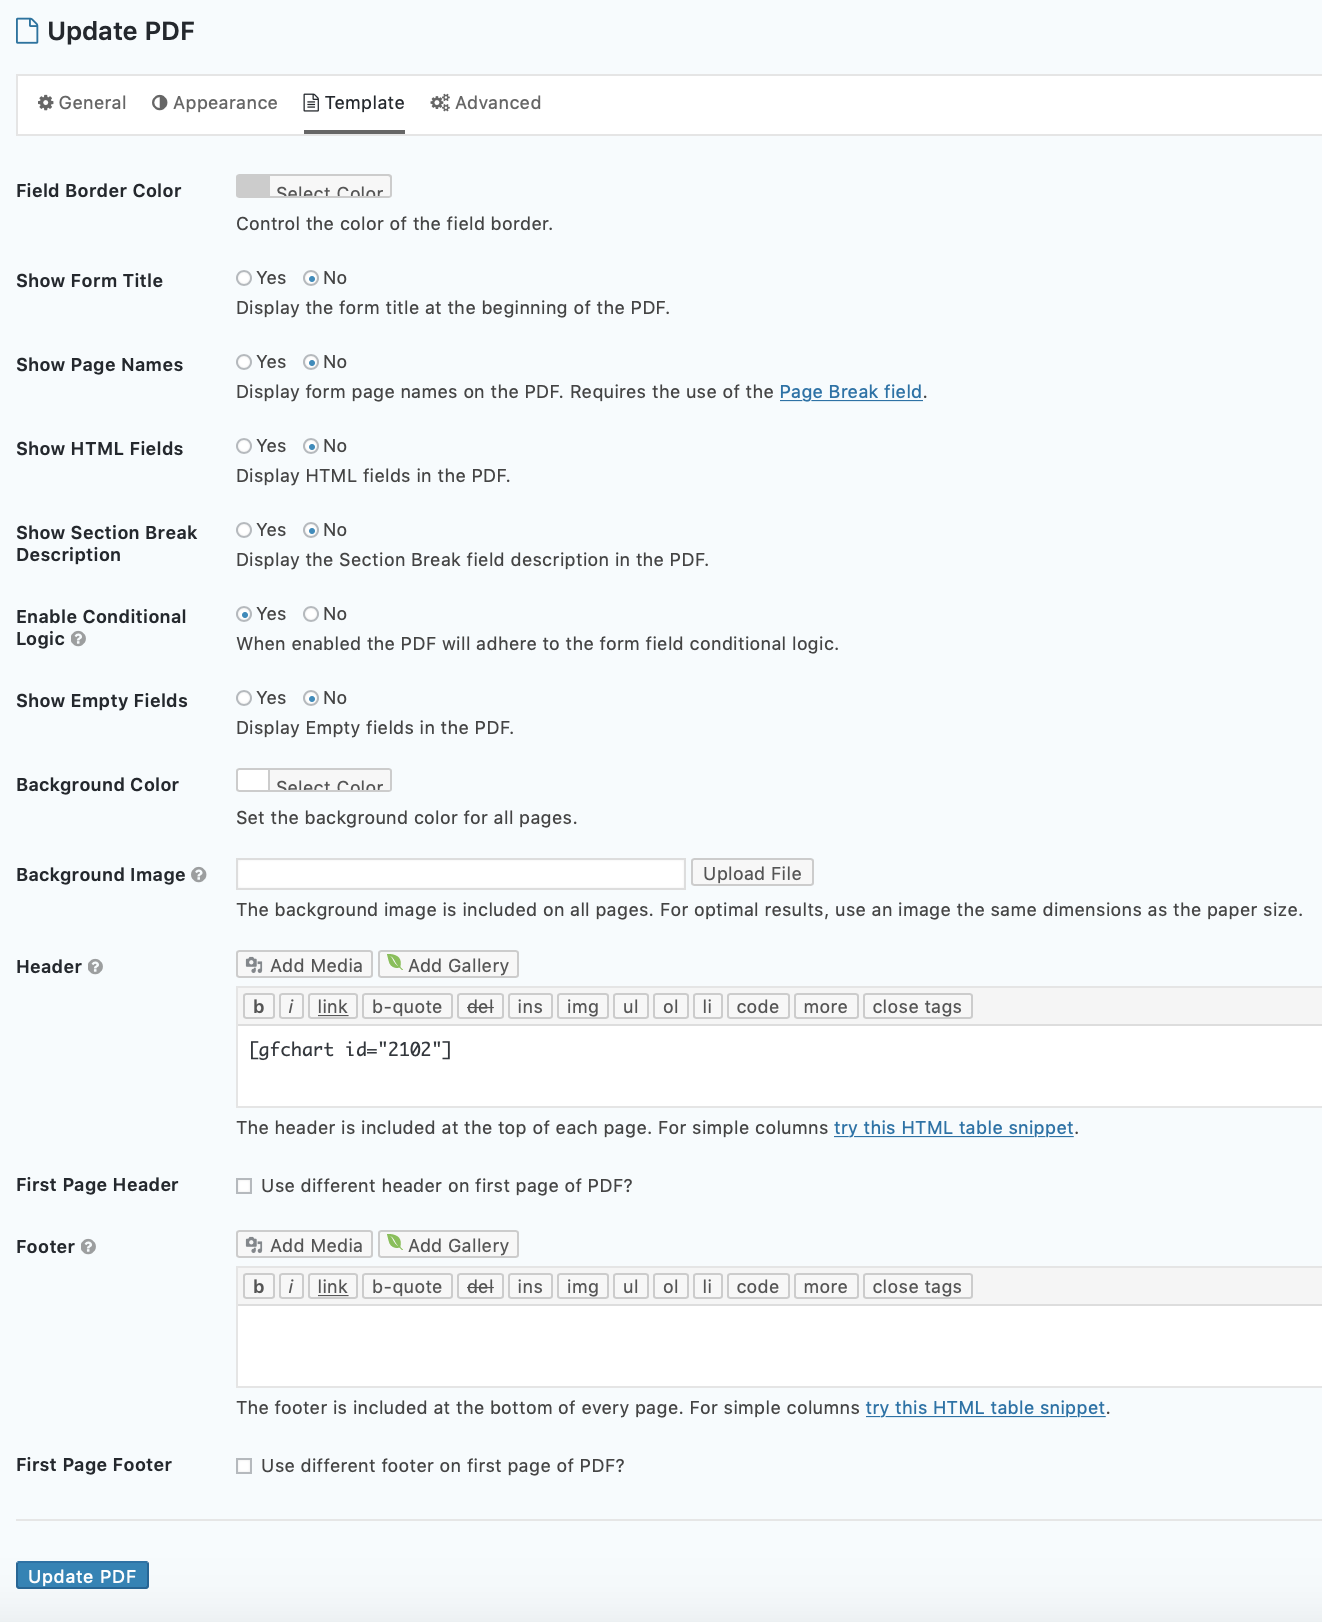
3. Select the ‘Template’ tab and scroll down to the ‘Header’ field. Insert a GFChart shortcode. This can be for any chart that has been created and contains data, it does not need to be associated with the current form. Press ‘Update PDF’.
4. Navigate to ‘Entries’. Under any entry, hover over the title until the sub menus appear below, then press on ‘View PDF’. The PDF should display with a chart in the header.
This format is unlikely to be useful for real use cases. To produce more useful PDFs you will need to customise your own PDF document. For full details please follow the GravityPDF documentation. Here is our basic guide based on our sample PDF.
Overview: designing your own report requires customising a php file. This is not as scary as it might sound because the key parts to configure are html. The GFChart shortcode is simply inserted into the html.
A. Download zadani-gfchart.php which is available as a zipped file for download for premium ‘GFChart ALL’ customers.
B. Look at lines 216-243 onwards where the format is specified in html. Edit the HTML according to your design and ensure that the GFChart shortcode appears where you want the chart to be inserted.
C. Upload the finished file into the appropriate folder with your WordPress install (where the other GravityPDF templates are located) usually /wp-content/uploads/PDF_EXTENDED_TEMPLATES.
D. Within Gravity Forms, within the form itself (not general Gravity Forms) under ‘settings > PDF’, configure the PDF (particularly under ‘Template’ select the template that you have designed).
Capabilities and known issues
- Supported: default pie, bar, calculation, charting vs time charts, personal assessment reports bar charts (not radar).
- Currently does not work with trend, progress charts or personal assessment reports radar charts.
- Images are responsive.
- Limited fault finding information e.g. no error messages are posted if our server cannot be reached or is down.
- Resizing of images is out of scope.
- Emails opened immediately after they are received may not initially contain charts (depending upon server demand, rendering may not be immediate). Return later and the charts should appear.
Important
Unlike any other GFChart capability, charts are rendered on a remote server.
- Whilst we have no plans to share your data, its privacy cannot be absolutely guaranteed
- Your host must have unrestricted access to the internet. Local installs, those behind firewalls, or with ‘under construction locks’ may experience issues.
- Emails sent from WordPress are notorious for delivery challenges. Resolving such issues is outside the scope of GFChart support.
- Recipients of emails must have images enabled within their email client.
Credits
Massive shout out to Jake and the GravityPDF team! It’s completely and utterly the best PDF solution for Gravity Forms.
Version history
1.1.2.beta1 (01-Apr-25) Fix: Enable horizontal DIY Bar Charts (previously vertical only).
1.1.1.beta1 (13-Jul-24) Fix: No critical error if Gravity Forms deactivated.
1.1.0.beta3 (10-Mar-24) New rendering server. Although a beta this has been tested for many months, releasing as a beta to understand any edge cases and usage volume.
1.0.2 (11-Jun-21) Enabled for DIY Bar Charts (with DIY Bar Charts v1.2).
1.0.1 (03-Jun-20) Improved automatic update capability.
1.0.0.beta2 (28-Jun-19) Updated release for customer testing purposes only (not production). Tweak to allow other shortcodes in Gravity PDF.
1.0.0.beta1 (21-Feb-19) Initial public beta release for testing purposes only (not production).
private beta (18-Oct-18) Initial private beta release.
Scheduled Notifications
Summary
The GFChart Scheduled Notifications add-on enables Gravity Forms email notifications to be sent on a preset schedule.
It is designed to be used with our Image Charts add-on to allow business reports to be automatically created and sent at the same time each day / week / month / etc.
Usage example:
Arrange for the boss to receive an email update of last week’s registrations automatically every Monday morning.
Solution overview:
- Create a business report within a Gravity Forms notification email using GFChart. Relative date filtering is recommended to report data over the desired timeframe.
- Optionally for a more professional look, produce a PDF report using GravityPDF, and attach to a Gravity Forms notification email.
- Schedule the notification to be sent with the desired frequency.
Requirements:
- Gravity Forms (any license).
- GFChart ALL license with Image Charts and Scheduled Notifications add-ons installed.
- WordPress Cron* administration plugin (such as WP Crontrol) to allow more refined testing and control of email notifications than is available within Scheduled Notifications.
*WordPress Cron is the default scheduling function within WordPress. Depending on site traffic volume and hosting it can be inaccurate (search Google for more detail). Some hosts offer their own version which is much more accurate e.g. WPEngine Alternate Cron which works perfectly with Scheduled Notifications. There are also 3rd party services e.g. SetCronJob (not tested by us).
Note also:
Reliable delivery of Gravity Forms email notifications can require some careful tuning to mitigate increasingly sensitive anti-spam protection. See Gravity Forms own troubleshooting advice.
Installation
GFChart All customers may download the plugin file from their account page. The filename is gfchart-scheduled-notifications.zip.
Within the WordPress install under ‘Plugins > Add new > Upload > Choose File > Install Now’ then ‘Activate’.
Configuration
The Scheduled Notifications add-on modifies the standard Gravity Forms ‘Notifications’ settings for a form by adding the following to the bottom:
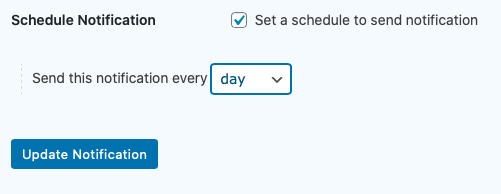
Schedule Notification: check box to set a schedule to send a notification.
Options: Send this notification every
- day
- week
- month
It actually doesn’t matter what this is set to initially because the Cron job scheduling is fully editable within WP Crontrol!
Overall solution suggested configuration
1. Install Scheduled Notifications, Image Charts, WP Crontrol (or equivalent). Confirm that you are using the latest version of GFChart. Confirm that your license key has been activated on your site.
2. Confirm that the time zone is set correctly in your WP install.
Navigate to ‘Settings’ > ‘General’ and look for ‘Timezone’. Specifying a city is better than UTC+/- to cope with any seasonal daytime saving adjustments in your locality.
3. Create Charts and/or calculations using GFChart. Within the ‘Select data’ tab, enter the appropriate relative date settings for your scenario.
For example, if you wish to report data from entries received within the last week, configure as shown here:
Note: received within the last week means at the moment the Chart/Calculation is displayed, in this case as determined by the Scheduled Notification settings.
4. Create a new Gravity Form and give it a clear title e.g. ‘Weekly registrations report sent via email’.
4a. To make it a valid form you will need to add a field. It doesn’t matter what you add, we suggest an email field. Save the form.
4b. Within the ‘Notifications’ settings for the form, configure a message to be sent to the desired (or entered) email address when a form entry is submitted. For testing purposes we recommend routing to your own email address.
4c. Design the layout of the report that will be emailed. Refer to Image Charts instructions for details. We recommend that you add text to the bottom of the report that tells the recipient from where it came and how to make changes. Even for testing purposes this is important.
4d. At the bottom of the settings configure to send a notification every day.
4e. Preview the form, create an entry, and press submit.
4f. Check that the email is received and formatted as you expected. If not then adjust or fault find. It is likely that you will receive the email twice after the first form submission.
5. If you do nothing further, this email will be resent daily at the same time to the same address. This is unlikely to be suitable for immediate testing because it is not regular enough. Hence we recommend the use of WP Crontrol (or equivalent) to change the frequency, and if necessary to terminate the schedule.
5a. Navigate to ‘Settings’ > ‘Cron Schedules’. Half way down the page press on the small ‘Manage Cron Events’ link. The list of Cron events is displayed in soonest order. Near the bottom look for an Action named: GFChart_Scheduled_Notifications::send_scheduled_notification(). It will look something like this:
![]()
5b. Edit / Run Now / Delete as appropriate.
5c. During testing, to assess the accuracy of your Cron timing on your server we recommend scheduling an hourly frequency initially. Later test daily and possibly then weekly if you need it.
5d. Once you are ready to launch a production version of the report use the ‘Edit’ function within Crontrol to set the desired schedule (time of day and frequency).
Version history
v1.3.0 (21-Apr-24):
- Fix: compatibility with Gravity Forms v2.5+
- Fix: conditionality on Gravity Forms added to prevent fatal error if Gravity Forms deactivated
- Tweak: form number added to scheduled notification ID to ensure unique identifier if forms are cloned
***Please upgrade to v1.3.0 via manual update. IMPORTANT to avoid critical errors, please first DELETE any existing WordPress chron jobs created by this plugin.***
v1.1.0 (22-Apr-20) Fix: improved automatic update reliability.
v1.0.0 (18-Mar-20) First release.
Survey customiser
The Survey Customiser allows users to modify chart bar or segment:
- Colours, to match the palette of the site, or meaning of the response.
- Order, ensure answers are displayed in the most logical order.
This add-on is available to GFChart All customers.
Use Cases
The Survey Customiser is specifically designed for the surveys. Its use in other use cases is possible, but may not match all expectations.
Installation
GFChart All customers may download the plugin file from their account page.
Within the WordPress install under ‘Plugins > Add new > Upload > Choose File > Install Now’ then ‘Activate’.
Configuration
The Survey Customiser extends the existing ‘Customiser’ Tab (previously called ‘Labels and Fonts’).
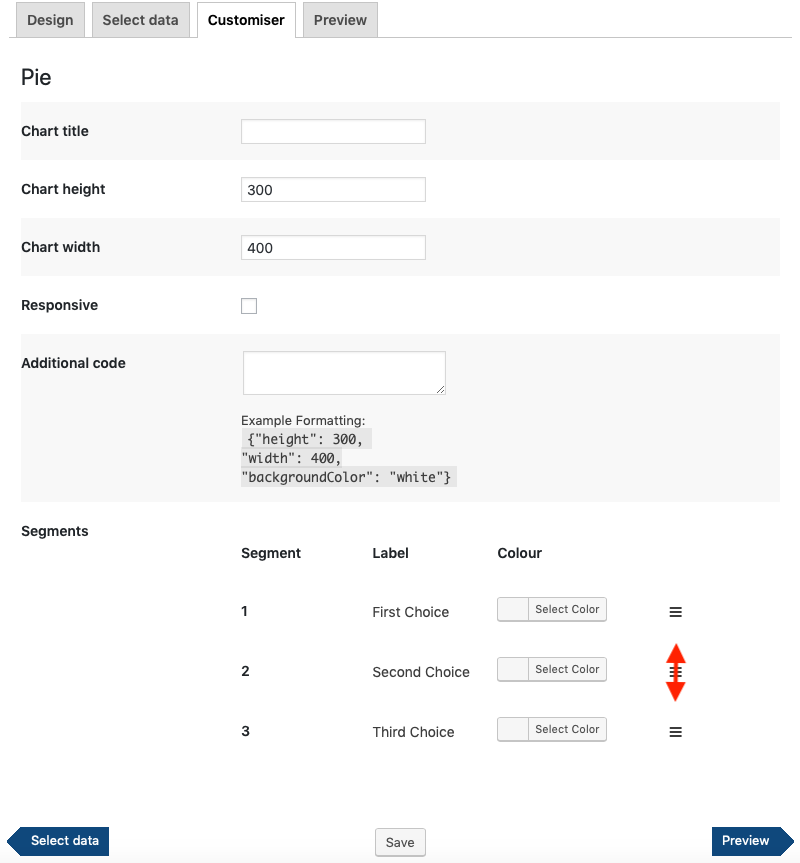
Use the icons on the right hand side to drag and drop the order of the bars / segments.
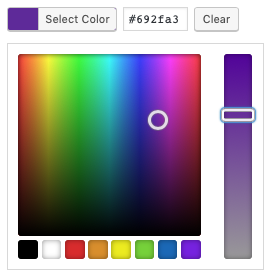
Use the ‘Select Color’ button to select the colour of the segment. Press ‘Clear’ to revert to default. Hex values can be entered using the keyboard.
Hint: to select a colour palette for your pie or bar chart, Google ‘color palette selector’ and many free options will be shown.
Important notes:
- Limited to surveys and fields that have choices. Tested and work: checkbox, radio button, survey likert. Tested and don’t work: survey checkboxes, pie ranking.
- If the choices or values are changed on the form, chart segments and current charts will break.
- Survey Customiser does not initiate until ‘Update’ is pressed.
- Initial ordering does not necessarily match that in the chart. Press ‘Update’ and preview to confirm ordering before making further changes.
- Do not use legend for bar charts with this customiser (colours will be wrong).
Pre-requisites
- WordPress v5.0+
- Gravity Forms v2.4+
- GFChart v1.12.0+
Version history
v1.3.1 (13-Jul-24) Fix: No critical error if Gravity Forms deactivated.
v1.3.0 (21-May-21) Fix: drag and drop bars fixed for Gravity Forms v2.5.
v1.2.0 (22-Apr-20) Fix: improved automatic update reliability.
v1.1.0 (19-Dec-19) Fix: correct pie chart operation for segments with no data.
v1.0.0 (21-May-19) Initial release with this limited documentation.
Text Add-On
Summary
The Text Add-On enables users to display a list of free text field submissions. It is ideal for surveys including free text comments.
This add-on is available to premium GFChart All customers.
Pre-requisites
- WordPress v4.3+
- Gravity Forms v1.9+
- GFChart v2.0.0+
Installation
GFChart All customers may download the plugin file from their account page.
Within the WordPress install under ‘Plugins > Add new > Upload > Choose File > Install Now’ then ‘Activate’.
Your GFChart All license key will enable automatic updates for this plugin.
Usage instructions
Version history
v0.5.1 (13-Jul-24) Fix: No critical error if Gravity Forms deactivated.
v0.5.beta1 (10-Oct-20) First release
Trend
Summary
The Trend Add-On allows users to plot data over time. Note every data point is plotted. Consider the Charting vs Time Add-On to plot data aggregated over time periods.
Trend Add-On capabilities:
- Line Chart (horizontal or vertical).
- Plotted value is a numeric value from the form.
- Date is either form submission date OR date field value.
- Single data series.
- Date is either form submission date OR date field value.
Use your mouse and mousewheel to zoom and pan around this example:
Version history
v1.2.0 (22-Jun-22) Tweak: improved reliability of date value reading.
v1.1.0 (18-Aug-21) Fix: dates with zero value data points now display. Note null is treated as zero value.
v1.0.0 (26-Feb-21) First release
Programmers
This section of the documentation is for solid PHP programmers with a good grasp of the WordPress hook system and JavaScript. If that’s not you, please get in touch with our friendly support team, and we’ll be happy to discuss the right solution for you.
We’ve attempted to make GFChart as programmer-friendly as possible, including hooks throughout the code and a public API for you to customize the software as needed.
The code itself will always be your best resource for the available hooks and how to use them (e.g. want to know how to create a new chart type? look at the Charting vs Time Add-On code).
In this section, we’ll outline some of the common actions we’ve seen, as well as the hooks necessary to achieve them to save some searching time.
Create your own chart types
gfchart_chart_types: define the chart typegfchart_config_file_paths: tell us where to find your admin configuration viewsgfchart_admin_enqueue_scripts: add any JS needed for the admin configurationgfchart_shortcode_scripts: add JS needed to display chart
Adjust chart filters
gfchart_get_filter_vars: filter the configured chart filters
Change chart configuration
gfchart_config:filter the configuration values set in the admin configuration UI
Change data after it’s been formatted for Google Charts
- Example: adding style columns
gfchart_api_format_bar_chart_data
Chart your own data
- Example: re-ordering data for display
gfchart_data_retriever_get_bar_chart_data: filter retrieved bar chart data before it’s formatted for Google Charts
Change Google chart options
gfchart_api_format_chart_options: filter Google Chart-formatted options- Note: If you simply need to control the look-and-feel of your charts, you can add your own Google Charts options in the additional code setting on the Customiser tab.
Using an alternative chart API
- You’d need to format the data for the chart API and then handle the front-end JS
gfchart_shortcode_scripts
License Upgrades
To upgrade your license:
1. Navigate to your account.
2. Login (if you don’t already have an account then create one here using the email address originally used for purchase).
3. Go to ‘Your account’ > ‘Purchase history’ > ‘View Licenses’ > ‘View upgrades’ and purchase from there.
4. A guide to the additional files available for your use is here.
Roadmap
Here’s our roadmap. And if there’s a feature you’d like but don’t see, here’s how to request a new feature.
Version History
v2.2.7 (released 22-Oct-25)
- Fix: license validation error.
v2.2.6 (released 10-Feb-25)
- Fix: update deprecated code in preparation for PHP v9.
v2.2.5 (released 01-Nov-24)
- Fix: critical error on sites with missing chart type definitions in certain circumstances.
v2.2.4 (released 21-Apr-24)
- Fix: critical error on sites running PHP v8+ containing shortcodes with invalid GFChart id fixed.
v2.2.3 (released 08-Jan-24)
- New: filter by source_url added to “Select Data” tab under “Enable additional filters”.
- Fix: relative date filtering fixed for time zones east of UTC.
- Tweak: EDD automatic update codebase updated to v1.9.2
v2.2.2 (released 12-Jul-22)
- Fix: reverted to v2.2.0 code based to avoid automatic update critical errors on some sites
v2.2.1 (released 11-Jul-22)
- New: gfchart_config filter extended to progress bar (credit: Nina Musser)
- Fix: EDD automatic update routine updated
v2.2.0 (released 27-Apr-21)
- New: Full compatibility with Gravity Forms v2.5.
- Fix: When using checkbox field, fixed an issue with the final option not counting within bar charts in certain conditions.
v2.1.1 (released 26-Jan-21)
- New: Gravity Forms survey, poll, and quiz field types (radio, dropdown, checkbox) supported for Pie and unsegmented Bar Charts.
- Fix: ‘Admin Menu Editor’ plugin full compatibility. Charts/Calculations menu new works correctly. Thanks to David Zuluaga and AME team.
- Fix: Various security enhancements following WPScan security assessment.
- Fix: Fatal error fix if Gravity Forms deactivated.
v2.0.0 (released 10-Oct-20)
- New: greaterthan and lessthan added to shortcode filtering.
- Improvement: Core refactored to use the Gravity Forms Query API to improve performance.
- Fix: Filtering with multiple conditions.
- Change: Date and time filtering based on local install time zone (no longer UTC).
- IMPORTANT BREAKING CHANGES: Affects coders only – GF_Query API replaces custom queries; GFChart_API::get_field_conditions, get_field_condition, and get_comparison_operator removed; GFChart_API::get_user_condition, get_payment_status_condition, and get_date_condition parameters changed.
v1.18.0 (released 17-Jul-20)
- Improvement: User interface enhancements.
- New: Dynamic filtering via shortcode.
- New: Filter according GravityView and GravityFlow status.
v1.17.0 (released 13-Jun-20)
- Improvement: Many layout and user interface enhancements.
- Improvement: Various security enhancements.
- Fix: special character and comma display issue fixed in charts.
- New: Checkbox fields enabled for Pie Charts.
- New: Payment Status field converted to drop down.
v1.16.0 (released 22-Apr-20)
- Improvement: ‘Add new’ button reliability improved on slower sites.
- Improvement: Automatic update reliability improved.
v1.15.0 (released 24-Mar-20)
- Improvement: Added ability to clear license key to aid updating of expired keys.
- Fix: Gutenberg block capability.
v1.14.0 (released 20-Dec-19)
- New: Gutenberg blocks capability in core.
- Fix: Non USD currency symbol fix in progress bar.
- Fix: Progress bar average calculations corrected for certain long decimal place numbers.
- Various other bug fixes.
v1.13.0 (released 30-Jul-19)
- Tweak: Improved reliability of automatic update facility.
v1.12.0 (released 21-May-19)
- New: Enabling changes for Survey Customiser (available separately).
- Change: ‘Labels and fonts’ tab renamed to ‘Customiser’.
- Fix: more than one additional filter reliability improved for certain field types.
- Removed: ‘Date’ field capability removed from ‘additional filter’ selection due to unreliability.
v1.11.0 (released 21-Feb-19)
- New: Underlying changes to enable new Image Charts add-on.
- Tweak: performance enhancements under the hood.
v1.10.0 (released 09-Mar-18)
- New: Responsive option added for pie, bar and time charts (Progress bars are already responsive).
- New: Address field support for pie and bar (unsegmented) charts.
- New: Unique values count calculation.
- Fix: Stacked bar charts that broke in v1.9.0.
v1.9.0 (released 24-Jan-18)
- Tweak: Gravity Forms v2.3 database compatibility
- Tweak: preparations to enable the forthcoming GFChart Charting vs Time premium extension
- GFChart should be upgraded to v1.9.0 before Gravity Forms is updated to v2.3.
- Customers who also use our GFChart GravityView extension should update that to v0.3 to ensure trouble free operation of that extension.
v1.8.0 (released 06-Jun-17)
- New: Gravity Forms number formats have been added to both calculations and progress bar (enables decimal places, thousands separator and currency)
- New: Chart/Calculation clone button alongside the ‘edit’ button in the main GFChart Charts/Calculations page.
- New: WP REST API support
- Depreciated jqplot (last used v0.53.RC2 Apr-15)
v1.6.0 (released 13-Mar-17)
- New: Checkbox / multi-select enablement for bar charts. Note that this does not support segments, summing, checkbox/multi-select fields having separate values from their labels, check box in product fields, pie charts, calculations or filters.
- New: more granular permissions, including edit_gfchart.
- Tweak: software licensing performance improvement.
- Fix: Members plugin capability (GFChart menu item no longer disappears when Members plugin + Gravity Forms permissions are chosen)
v1.5.0 (released 23-Dec-16)
- New: relative date filtering introduced.
- New: back end changes to enable front end filtering in v0.2 of the GravityView add-on.
- Tweak: software licensing performance improvement. Moved from using Transients API to Options API to improve performance, typically on those sites running W3 Total Cache.
v1.4.0 (released 21-Oct-16)
- New: support for charts in the WordPress admin area*.
- New: new ‘gfchart_config’ filter (credit: Serafín Danessa)*.
- Tweak: software licensing reliability improvement.
*these new developer features are currently not supported by our help desk.
v1.3.0 (released 29-Aug-16)
- New: import and export Charts/Calculations alongside forms.
- Tweak: UI improved to show which page(s) Chart/Calculation(s) appear on.
- Fix: malfunctioning capability removed from the admin bar.
- Fix: broken images fixed for non-standard WordPress installs.
v1.2.0 (released 28-Jun-16)
- New: Bar and Pie charts for Gravity Forms Survey Likert, Radio Buttons, Rating, Drop Down and Ranking fields. Note checkbox and multi-select checkbox are not supported.
- New: calculation of average.
- Confirmed: full compatibility with Gravity Forms v2.0
v1.1.0 (released 21-May-16)
- New: for sales reports – select field to sum in bar charts
- New: for sales reports – new filter for entry payment status
- New: for surveys – display fields with zero values in bar charts (unsegmented data only)
- Tweak: UI enhancement to make it clear that the source form cannot be changed once set
- Fix: correction to the bar chart sum calculation formula
v1.0.1 (released 22-Apr-16)
- Fix: corrected formatting of other plugin pop-up boxes triggered from edit post/page screen (e.g. Gravity Forms ‘add form’)
- Tweak: 1-click updates reliability improvements
v1.0.0 (released 25-Mar-16)
- New: Progress vs. target bar chart.
- New: Column ordering options for bar charts.
- Improved: license status indicator added to the ‘settings’ page.
- Improved: various user interface enhancements.
- Improved: documentation on the plugin website.
- Fix: correct form now shown associated with the Chart/Calculation in the main Chart/Calculation page.
- Fix: conflict with the ‘Members’ plugin.
v0.9 (released 14-Feb-16)
- New: Enhanced calculation capability (count entries or mathematically sum fields) with filter options.
- New: Date range filter for all charts and calculations.
- No change yet: full backwards compatibility with v0.53RC2 but Advanced warning: jqPlot pie and bar charts last used in v0.53RC2 will be depreciated soon. Use bar or pie charts designed with the new user interface instead.
v0.7 (released 08-Jan-16)
- New: Vertical and Horizontal bar charts (using Google Charts and the friendly user interface)
- New: Stacking absolute and percent options
- New: auto scaling of the axis ticks
- Tweak: 100% compatible with WordPress v4.4
- Tweak: General clean up of internationalisation strings
- No change: full backwards compatibility with v0.53RC2.
v0.6 (released 11-Nov-15)
- No change: full backwards compatibility with v0.53RC2.
- New: user-friendly interface to design pie charts.
- New: automatic plotting of pie chart elements, without having to specify them in the shortcode.
- New: comprehensive filtering options.
- New: introduced Google Charts for charts designed with the new user interface.
- New: 3D and donut options.
- New: access to Google Charts formatting options, including size.
- New: button to easily insert charts into posts or pages.
- Fix: license activation issue with a few websites.
v0.53.RC2 Fixed issue with charts not appearing on some installations (released 01-Apr-15)
v0.53.RC1 (released 22-Mar-15)
- Introduced second filter into counter
- Introduced filter for logged in user for counter and charts
- Introduced automatic update and licensing capability
- Rebuilt some code to use Gravity Forms API and adopt better coding practices
v0.52 Fixed bug with graphs not appearing in some installations (10-May-14).
v0.51 First release (14-Apr-14).
Credits
- gravity+
- jqPlot Charts and Graphs for jQuery
- The Google Charts portions of the plugin are modifications based on work created and shared by Google and used according to terms described in the Creative Commons 3.0 Attribution License.