
Like a lot of organizations, you collect data that needs to be shared with your internal team and/or external stakeholders. Information is power, as they say, but only if people have access to it. If you don’t distribute your data appropriately, your team and stakeholders can’t make smart decisions.
Admittedly, there are lots of ways to collect, compile, and display data, but we find that most analytics tools are far more complicated than most people need. Furthermore, analytics tools are clunky when you start involving multiple users who all need to submit their own data points.
In this article, we’d like to offer a simple process to share data with your team. These basic steps will show you how to collect, visualize, and publish your data for anyone to access. You won’t need to learn special tools or platforms. All you need is a general understanding of WordPress.
If you don’t distribute your data appropriately, your team and stakeholders can’t make smart decisions. Share on XStep 1: Determine What You’ll Share
Your first step is to decide which pieces of information are worth sharing with your team and stakeholders. Too little data may not paint a clear picture, but too much could be overwhelming.
For instance, imagine you’ve just completed a series of optimization tests for your landing page. You want to show off the improvements to your organization, but you don’t need to recount the details of every experiment and minor change. Rather than bore them with the minutia, it makes more sense to simply give them the results; a before and after look.
In other cases, however, a robust presentation of data may be more appropriate, especially if the data is used to make decisions. Using our example, the entire organization may not need the details of every optimization experiment, but the conversion team certainly does, so it makes sense to give them the details.
Step 2: Compile Your Data through Forms
Once you know what types of data you want to share with your team and stakeholders, the next step is to collect it in one place.
Since this guide is focused on keeping things simple, we recommend collecting data through a form. Our favorite form plugin is Gravity Forms because it’s powerful yet easy for beginners.
After installing Gravity Forms to your WordPress site (read this guide if you don’t know how), you’ll need to build a form. Click Forms > New Form in your WordPress backend, give your form a name, and then click Create Form.
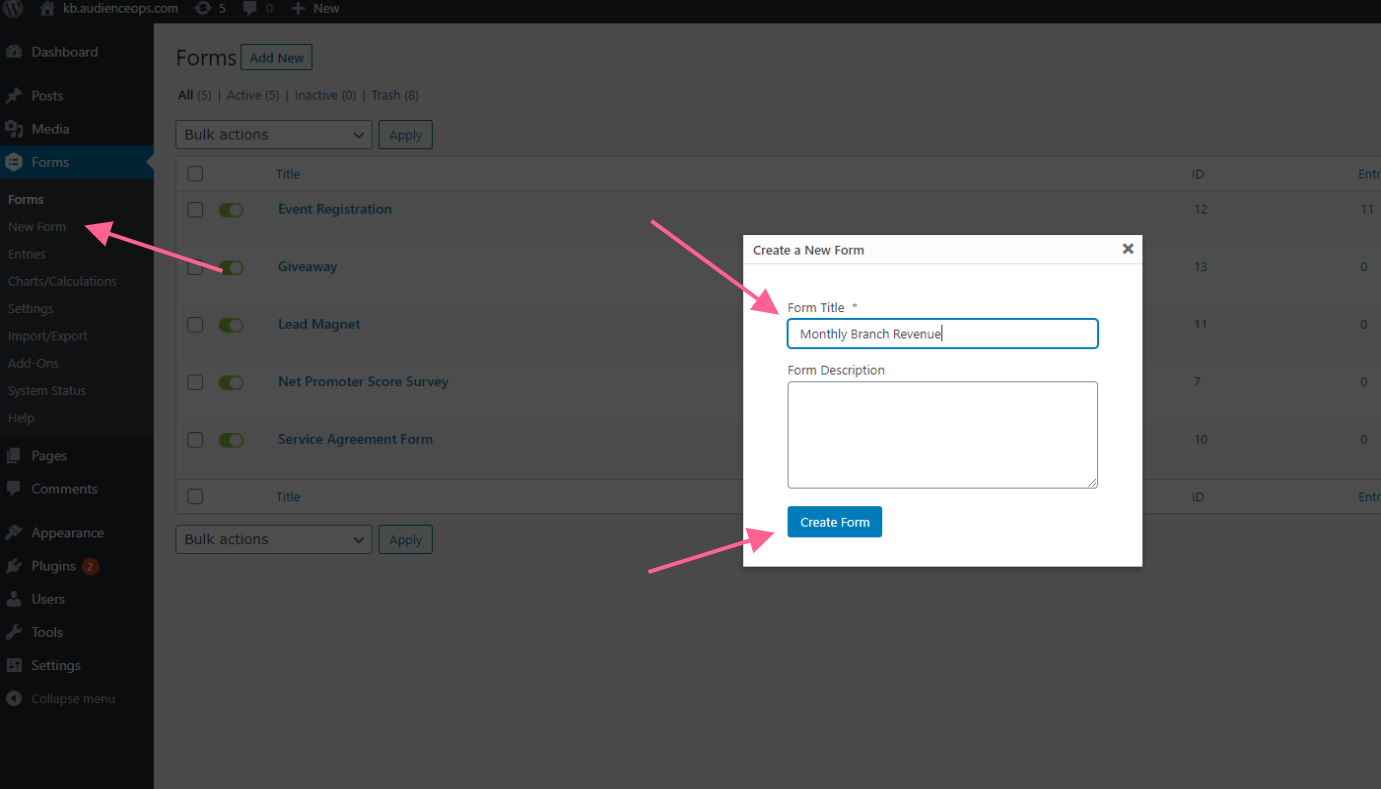
For the purposes of this tutorial, we’re going to create a monthly revenue form for a fictional organization with multiple branches. Sales teams at each branch will submit their revenue numbers each month. (In fact, this is similar to how one of our customers uses GFChart. They ask car salesmen to regularly submit their sales figures for the dealer network to analyze.)
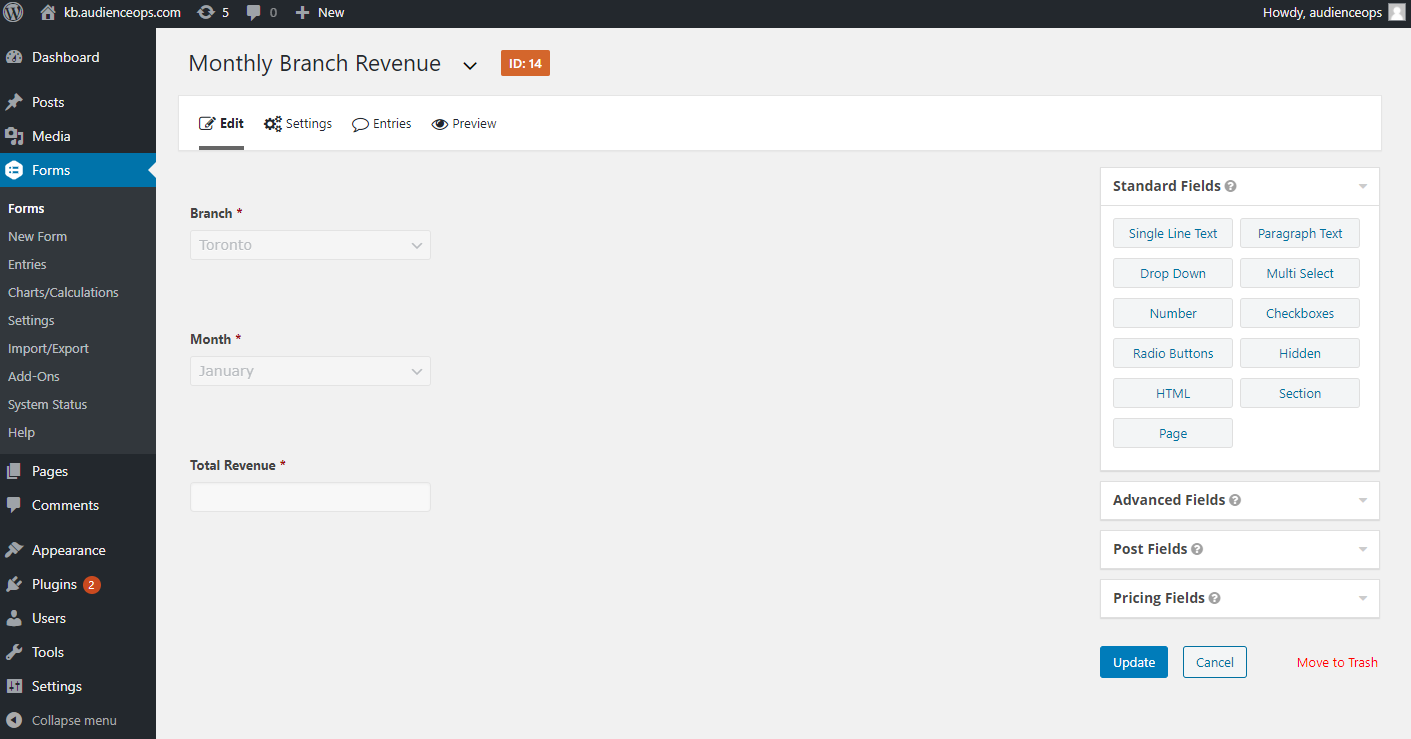
Next, build your form by adding fields for the data points you want to collect. We won’t go into too much detail about building a form here, but we suggest reading Gravity Form’s full guide if you need help. Click Update when you’re done.
Your last step is to add a form to a page so people in your organization can access it in order to submit data. Open any page in your WordPress backend. Hit the + symbol to open the Gutenberg block selector. Click on the Gravity Form block and select the form you want displayed. Your editor will look like this:
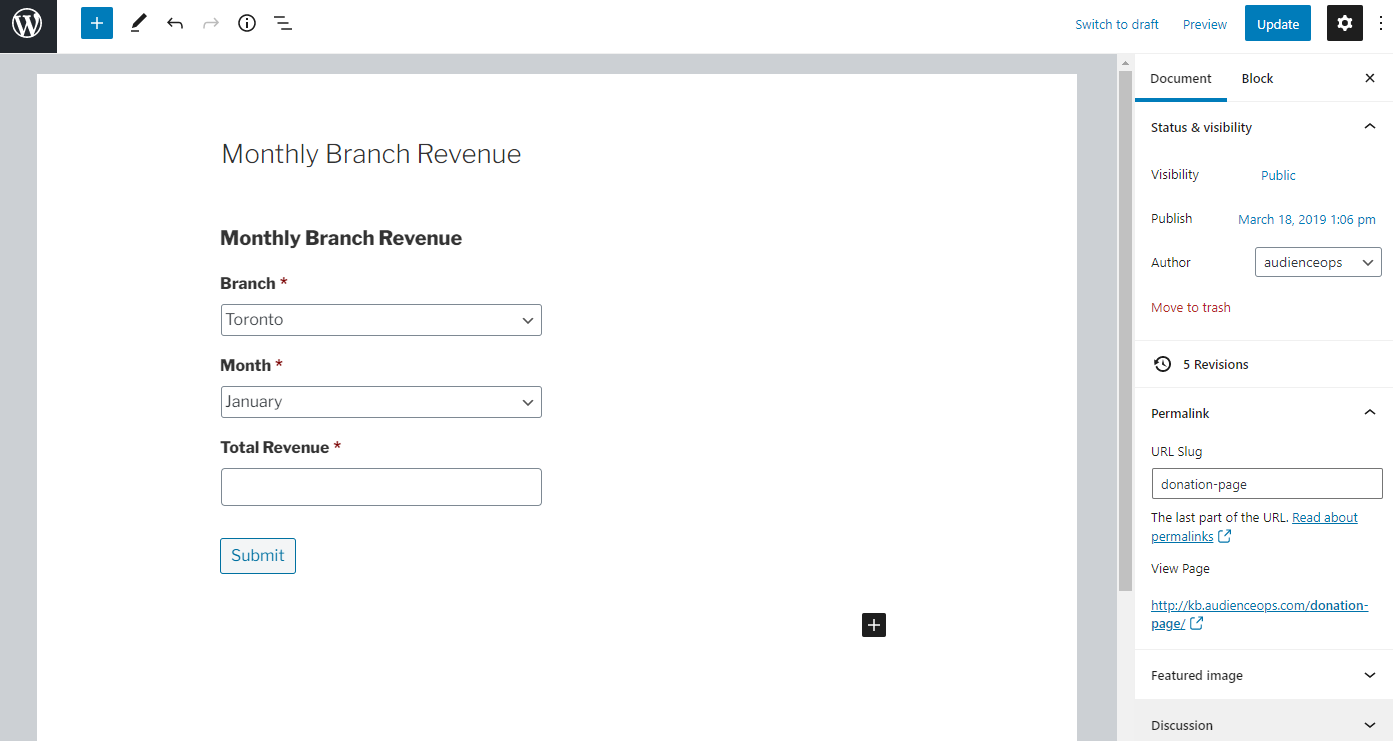
Once you view the page, you should see the form. When someone submits data through the form, it will be stored with the form’s entries.
Step 3: Display the Data as Charts
Now that you’re collecting data, the next step is to make it available for viewing on your website. Fortunately, this is super simple with GFChart, a charting extension for Gravity Forms.
Why use a chart? Because raw data is hard to understand, especially if you’re sharing it with people who don’t work with data regularly. Charting creates a visual element that helps people understand patterns and trends.
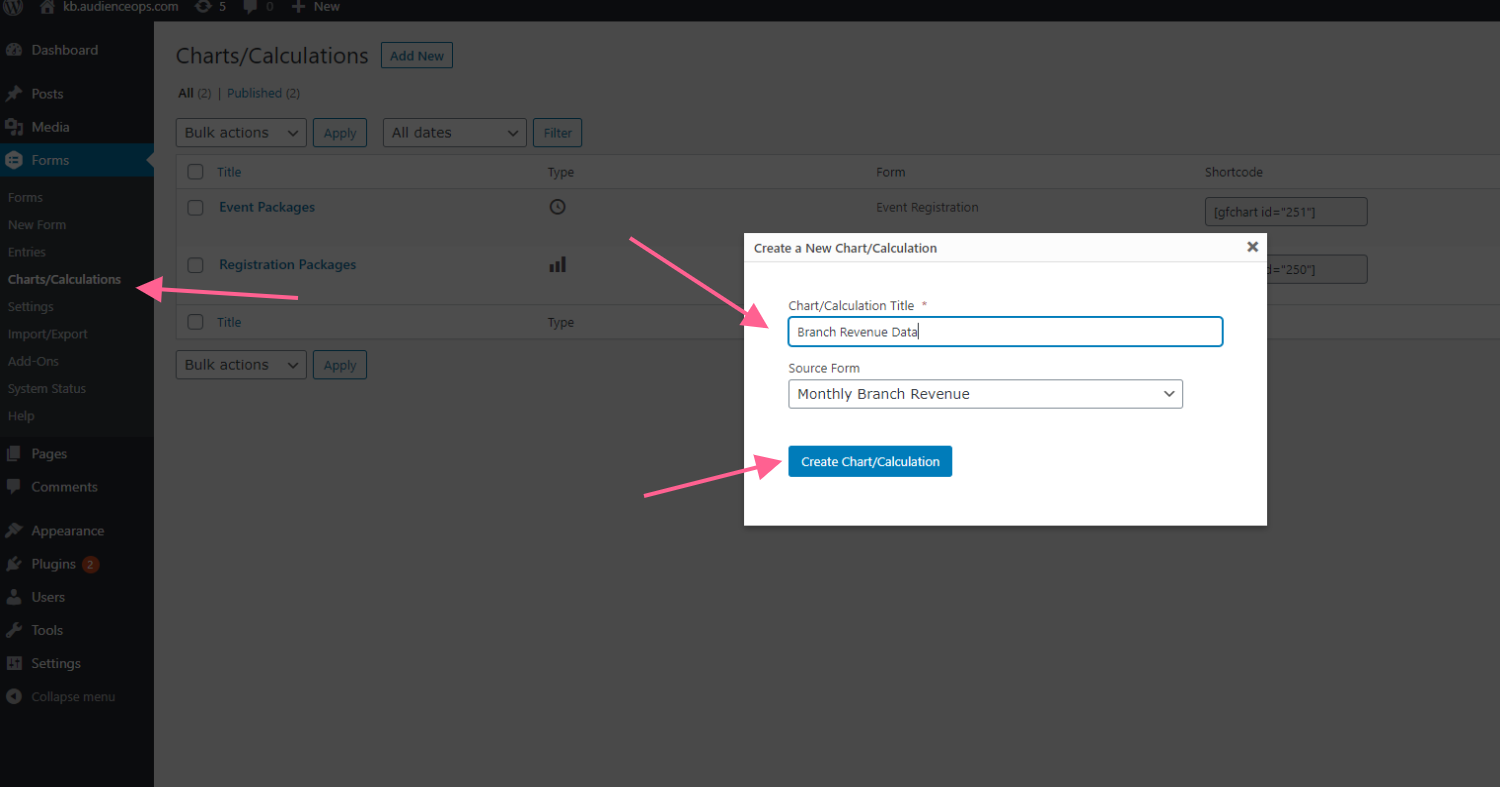
After installing GFChart, create a new calculation by clicking Forms > Charts/Calculations, giving your calculation a name, and the clicking Create Chart/Calculation.
In the chart editor, you’re presented with four tabs:
- Design: Choose the format of your chart. This depends on the type of information you want to present. You can choose a pie chart, bar graph, calculation, progress bar, time graph, or simply display the data as text.
- Select Data: Choose how the chart will display your data.
- Customiser: Making styling changes to the chart.
- Preview: See how the chart will look on your site before publishing it live.
Once you’re happy with your form, click Update to save. Before you exit the page, copy the chart’s shortcode to your clipboard.
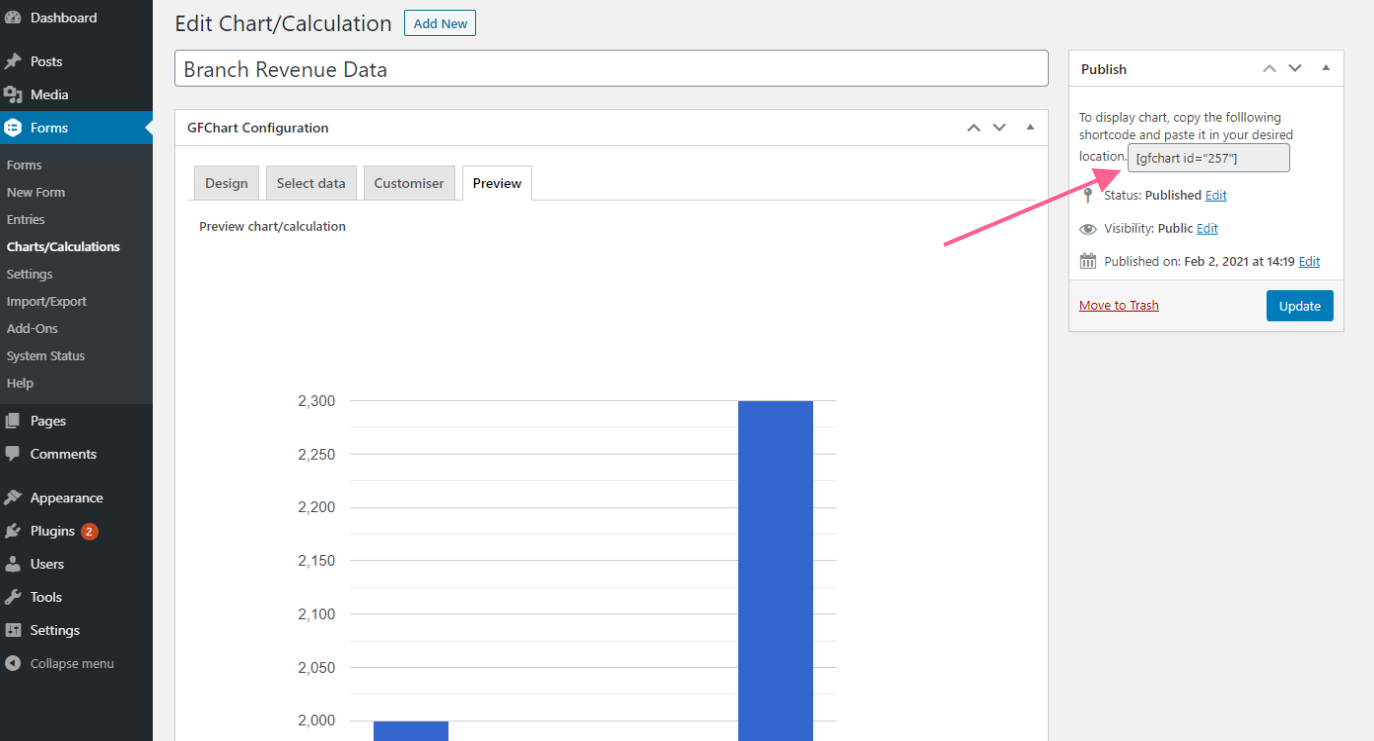
To display your chart on your website, create a page or post in WordPress, add the Gutenberg shortcode block, and paste in your chart’s shortcode. You can add as many charts to the page as you like. View the page to make sure it looks right.
Step 4: Add Your Own Commentary
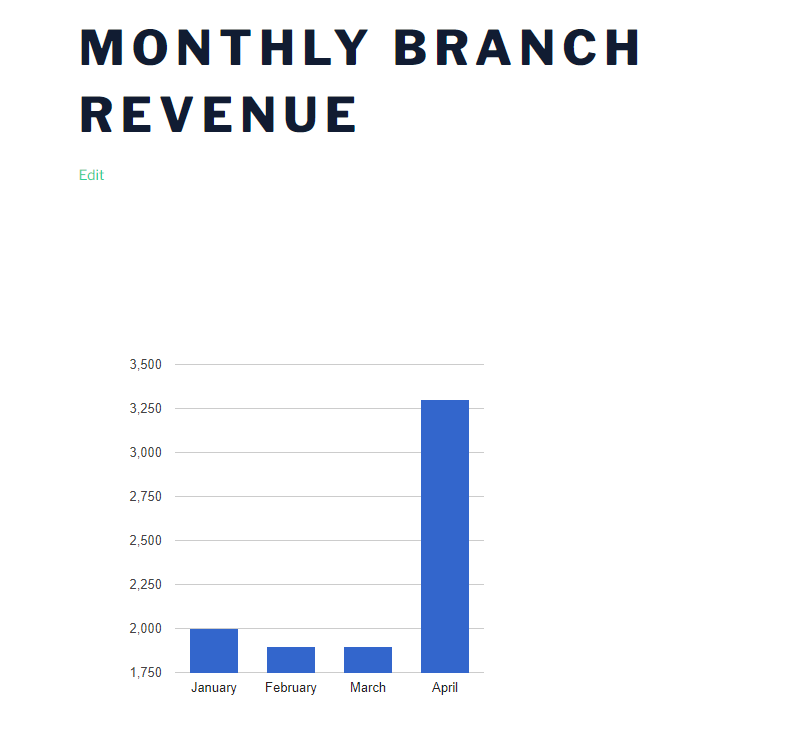
While you’re in the page or post editor, we recommend adding some commentary to your chart to help your team and stakeholders understand the data. What you say will depend on the type of data you’re presenting and who will view it, but it’s a good idea to explain what it means.
Why bother? Because data on its own isn’t always helpful. You often need context to understand it. For instance, whoever views the chart above might wonder why April was such a good month. You might explain that it was your big April sale or that you signed a new big client.
You don’t have to be long-winded here. In most cases, a few bullet points are enough to help your team understand the data. If you write too much, they might ignore it.
Step 5: Share the Page with Your Team
Your data visualization is now live on your website, so your final step is to make everyone aware of it. Send links to anyone who needs access to that kind of information.
If you want to hide certain pages on your site so the general public can’t access them, use the Members Word Plugin by Justin Tadlock. It gives you finer control over who interacts with your website.
If you prefer not to publish your charts with your team, consider adding the Gravity PDF plugin to your WordPress site. It integrates with GFChart to turn the information you already collected with Gravity Forms into powerful and attractive reports. It also allows you to segment and filter data using pre-defined parameters.
Going Forward
Now that you have an easy way to collect and share data, we recommend scaling it up quickly. Once your charts are in place, adding new data points is as simple as submitting a form. The existing charts will update accordingly on your website based on the new data points.
As you can see, this process will save a lot of time that you might normally spend formatting charts In graphs manually. It will also save you the trouble of using an unnecessarily complex analytics tool that comes with more features than you’ll ever need. Get started with GFChart now.