
Surveys are great tools to learn more about a group of people. They can help you gather valuable insight in an efficient manner. It would be far too difficult to speak to a large group of people individually, so sometimes surveys are the only way to collect feedback.
With the right tools, you can survey anyone you like. You might ask customers how they feel about their recent purchase. You might ask employees what they think about their jobs or whether event attendees enjoyed the event. There are no limits to what you can learn.
Essentially, a survey is just a form. You can build a survey with any forms tool. But it helps to use a tool that comes with special survey functionality. That’s why you need a tool like Gravity Forms. It offers robust functionality for all of your form needs.
But what if you want to display the results of your survey to your audience? Imagine after completing a survey, your participants are sent to a page where they could look at the results in real time. Or you may want to link this page to your team, leaders, or stakeholders so they can keep tabs on the survey responses.
This is called live reporting and it’s a great way to boost the usefulness of your surveys. In order to build a survey form with live charts, you’ll need to build two pieces: the survey and the chart. Let’s walk through each component.
It’s difficult to speak to a large group individually, so sometimes surveys are the only way to collect feedback. Share on XHow to Build a Survey Form
To build a survey form on WordPress, you’ll need Gravity Forms and its Survey Add-On. The add-on comes with an Elite license, but it’s worth the small cost.
The Survey Add-On adds a Survey field to the Gravity Forms form editor. This field offers eight options to create your questions:
- Likert: Users can choose from a number of options along a scale. (E.g. “Strongly Agree” to “Strongly Disagree.”)
- Rank: Users can put options in their own order.
- Rating: Users can choose a star rating.
- Checkboxes: Users can select multiple options.
- Dropdown: Users can select an option from a list.
- Paragraph Text: Users can input multiple lines of their own text.
If you aren’t sure what a survey form looks like, check out this sample survey by Gravity Forms.
Once you have the Survey Add-On installed, building a survey is the same as building any other Gravity Form. Click on Forms > Add New Form to open a new form. Give it a unique name. (If you like, you can also add survey questions to existing forms).
Before you add survey questions, we recommend adding a few basic fields to your form, like the Name and Email fields. These will help you identify your participants. When you publish the results of your survey on a live page, these basic fields will not appear.
Next, add the Survey field from the bank of Advanced fields.
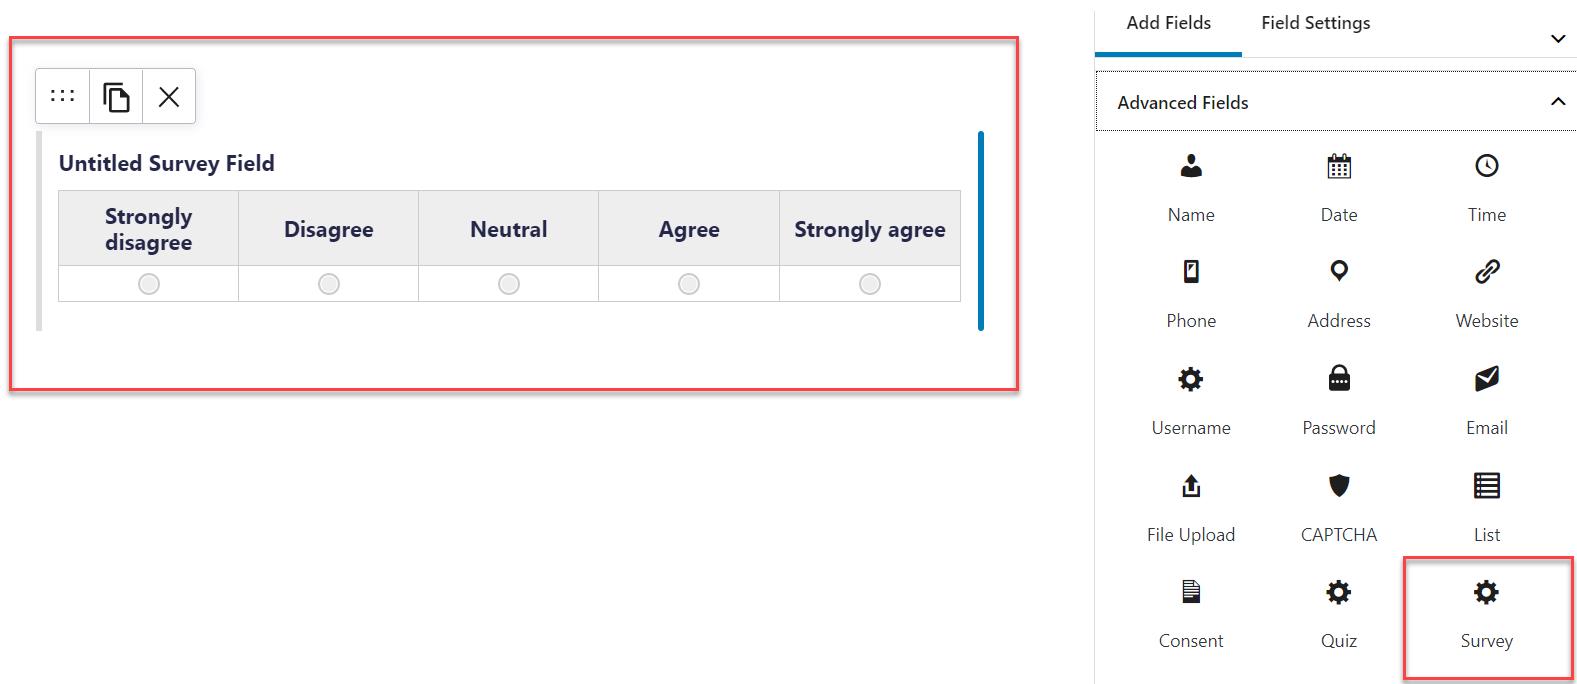
There are three steps to configure this field:
- Under “Survey Question,” input a question that will appear above the choices. For instance, you might ask, “Who was your favorite speaker at our event?”
- Under “Survey Field Type,” select the type of field you want this to be. (These are the eight options we listed above).
- Under “Columns/Choices,” insert the different options the user can select from.
Before completing this field, browse the Appearance and Advanced tabs to explore some additional options. You may want to change how the for looks or how it interacts with other fields in the same form. Then repeat this process for each of your survey questions.
Finally, you’ll need to add your form to a public page on your site so participants can access it. There are a few ways to do this, but the easiest way is to simply add the Gravity Forms Gutenberg block to any page or post from the WordPress editor. It’s just like embedding any other Gravity Form.
We also recommend checking with the form’s notification and confirmation settings to make sure users get the appropriate on-screen and email messages. In the case of surveys, there’s generally no need to send your participants a copy of their responses, but you may want to send a quick thank you along with anything you promised in exchange for their participation (like a coupon or a piece of premium content).
If you need a little help on creating a survey, check out Gravity Forms’ documentation.
How to Set Up Live Reporting
Once your survey is published to a page, the next step is to add live reporting so everyone can see the results of the survey in real time. To do this, you’ll need GFChart, a charting plugin for Gravity Forms.
Furthermore, you might want to grab the Survey Customiser add-on for GFChart as well. It is specifically designed for the surveys and allows you to modify bars or segments based on colors (to match the palette of the site or meaning of the response) and order (to ensure answers are displayed in the most logical order).
This add-on is available to GFChart All customers. You may download the plugin file from your account page.
Note: In order to see the results of a survey, your survey needs to have some responses. If no one has completed your survey yet, you may want to submit some test entries so something appears on the final chat. You can always delete these entries later.
To get started, click on Forms > Charts/Calculations to open a new form. Give it a unique name to distinguish it from other charts.
Building a chart for a survey is similar to building any type of GFChart. You’ll need a separate chart/calculation for each of your survey questions. Building a chart takes four steps (these are the four tabs of the chart builder):
- Select the design of your chart. This will depend on the type of question. If you’re tallying up options on a checkbox field, you’ll probably want the bar chart. If you’re showing off responses of a likert field, you probably want a pie chart.
- Select the data this chart will use. This is where you map the question’s responses to the chart. For instance, for a bar chart you would need to tell GFChart which value is the x axis and which is the y axis.
- Customize the appearance of your chart via size, colors, and custom CSS.
- Preview the chart in the previewer before embedding it on a live page.
Ultimately, you have a lot of flexibility with the appearance of your chart. You can present them however you like so they remain clear and useful. You can even customize their colors so they match the look of your website and/or survey.
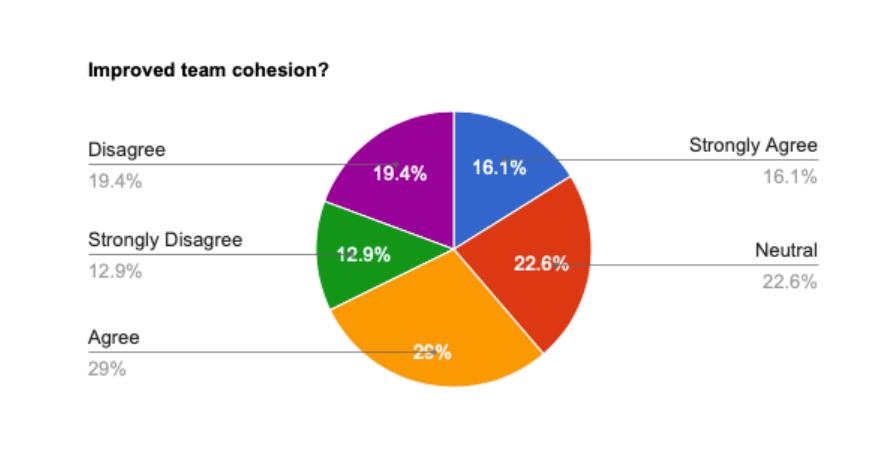
Here’s an example of a survey question turned into a pie chart:
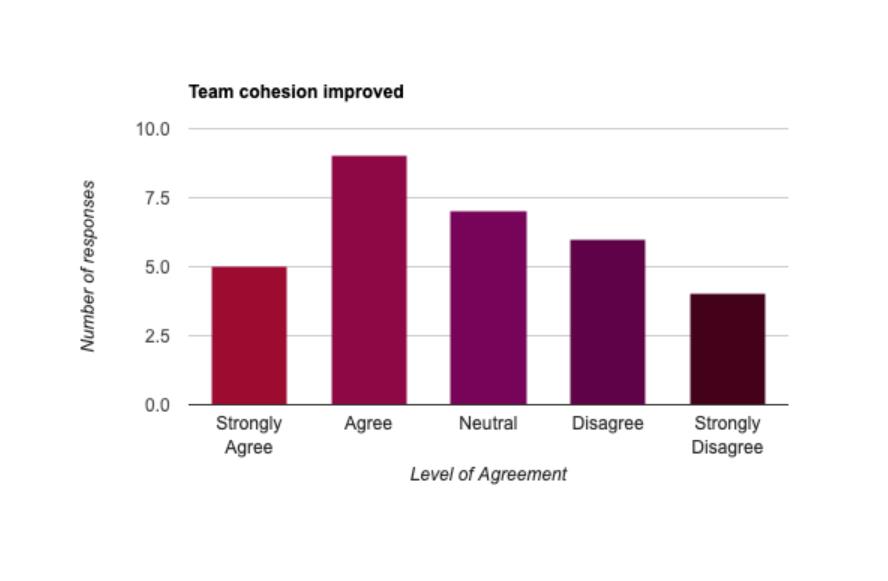
And here’s the same survey question presented as a bar chart:
Once you’re happy with the look of your chart, your last step is to embed it on a page. Use the GFChart Gutenberg block to add your charts to any pages and posts.
Since each chart represents a different question, you can organize your charts on the page any way you like. You aren’t bound to the same question order as the survey. This is useful if you want to add other elements between your charts, such as text and images that give your survey questions more context.
Summary
Surveys are simple tools, but they give you powerful insights into your organization and audience. By following this tutorial, you’ll develop an impactful survey with transparent results.