You Can Now Include ‘Live’ Charts And Calculations In Your Emails And PDF’s.
Visual communication helps readers understand content. GFChart now has the capability to render charts and calculations into emails and PDFs.

Visual communication helps readers understand content. GFChart now has the capability to render charts and calculations into emails and PDFs.
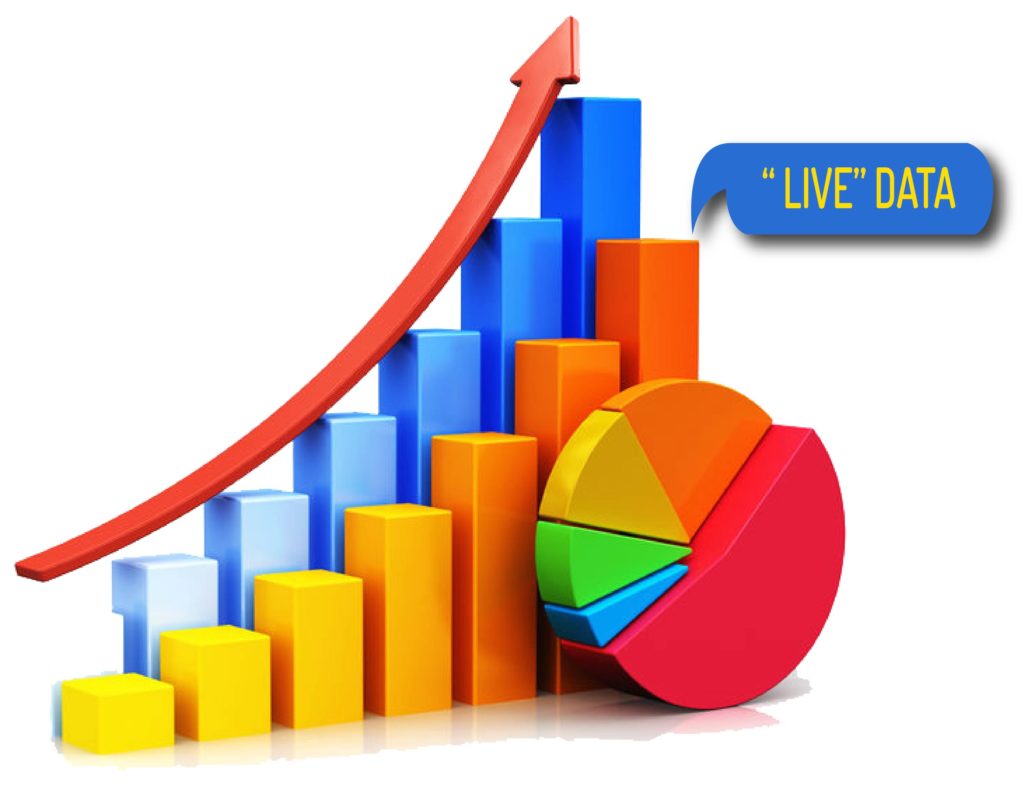
Do you want to show Live Data from your Gravity Forms as a Bar Chart, Pie Chart, 3D Pie Chart or a Donut Chart inside your blog posts and pages? This is the way to do it.
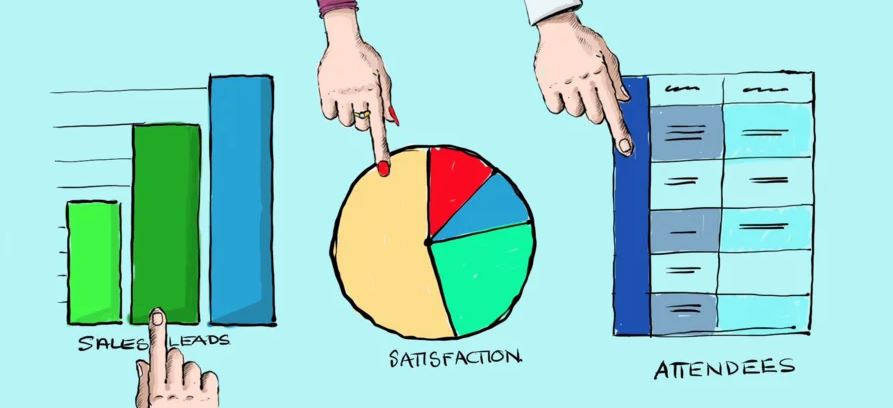
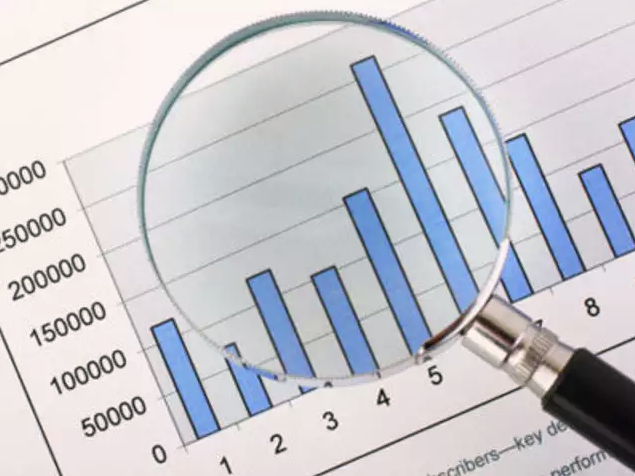
If you collect data from customer enquiry forms, surveys, booking requests, or quizzes, then you’ll understand that the data alone can be difficult to interpret until you see it in graphs and charts.
Until then, that data is just numbers and words on a page or spreadsheet.