
According to Gravity WP, GFChart is the best chart / calculation add-on for Gravity Forms out there.
Do you want to show ‘Live” data from your Gravity Forms as a Bar Chart, Pie Chart, 3D Pie Chart or a Donut Chart inside your blog posts and pages? This is the way to do it.
You can easily make Bar charts (even very complex ones) from the data your website visitors filled in via Gravity Forms and the plugin GFChart. This plugin is an extension to WordPress Gravity Forms. It empowers you to showcase a visual snapshot summary of form submissions – automatically.H
Gravity Forms ‘Live’ Charts examples
Here Is How You Create Live Data Charts
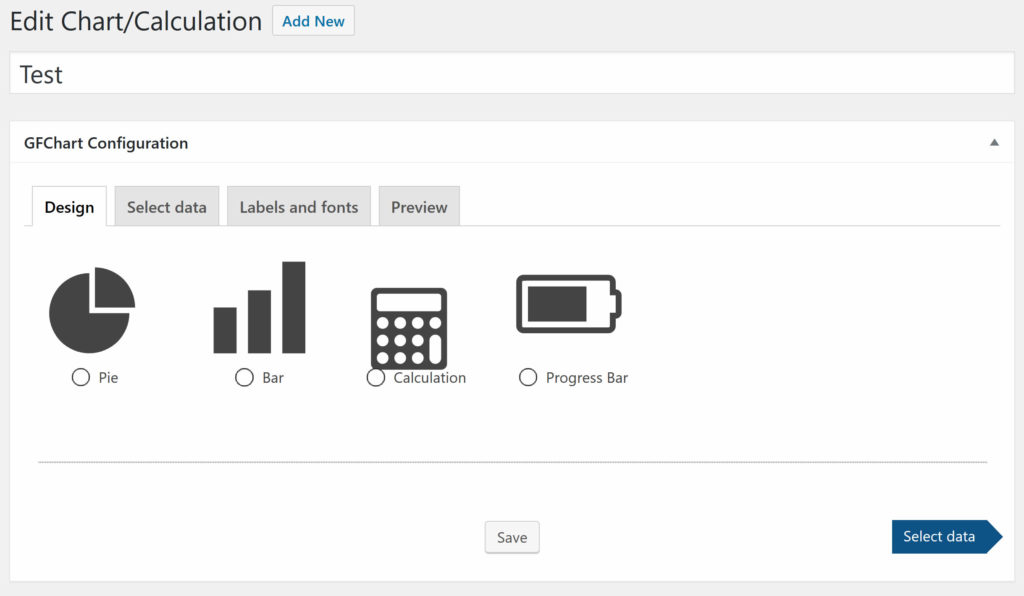
Choose Chart Type
You can choose several Chart types to show your Gravity Forms data: Bar chart, Pie (Donut) Chart, Calculations and a Progress Bar. Per Chart Type there are more options to create, for example 3D views.
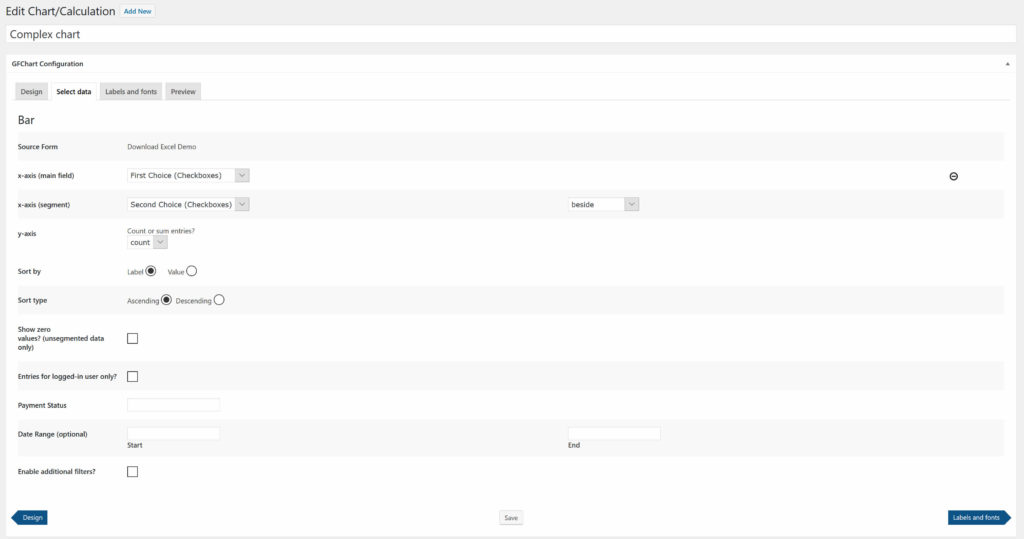
Select and filter data for your GF Chart
You can select and filter (based on conditional logic) data to use and count (or sum) in your Gravity Forms Charts. No need to code it yourself, just click and generate.
Features of GFCharts
Fast Front-End Analytics Gravity Forms
Quickly show analytics based on Gravity Forms entries on the front-end of your website, so people can follow how many and what type of entries are submitted.
Conditional Logic
Filter specific entries based on information people have filled in. This way you can easily create different kinds of charts, or calculations from one form.