If your business uses data in any way (and let’s face it – most businesses use data these days), you know the importance of sharing that information with your team, leaders, and stakeholders. Depending on your business model, you may also need to share data with your customers, followers, and vendors.
But data on its own is boring and unengaging. No one gets excited over columns and rows of numbers. In fact, raw data on its own is difficult to understand. Your readers need some kind of visualization to help them see the meaning behind your data.
The solution to raw data is to turn it into accurate and accessible reports using a WordPress plugin. The right plugin will display your data in a professional way that your readers understand.
In this article, we’ll introduce you to several of the best WordPress report builder plugins. We’ll then break down each tool to help you understand which is right for your needs.
The solution to raw data is to turn it into accurate and accessible reports using a WordPress plugin. Share on X1. GFChart
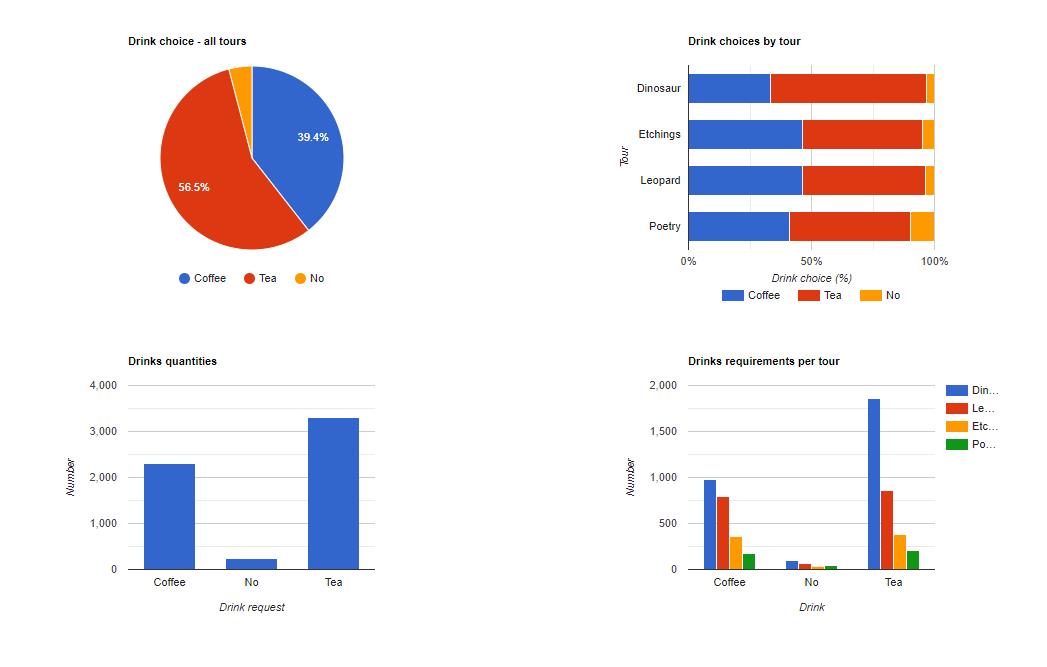
GFChart is a WordPress charts and graphs creator plugin that turns Gravity Forms data into professional visualizations. It’s a simple way to design visually appealing charts from your forms data. Simply create a chart or calculation and embed them on a page or post to produce a live report.
Unlike other plugins, GFChart is easy to configure through an intuitive user interface. It’s ideal for assessments, surveys, registrations, and sales. You can create pie charts (normal, 3D and donut), bar charts (horizontal and vertical), line charts, progress bars, and calculations (count/sum/average/unique values). You can also chart vs time and give users the option to use filters. You have total control over the size, fonts, colors, and position.

GFChart is part of the Gravity Forms ecosystem, the most popular WordPress forms plugin. This creates massive opportunities for specialized functionality. For instance, GFChart integrates closely with other third-party plugins, such as GravityView and GravityPDF.
The best part about GFChart is that there is no coding required. The chart creator is visual-based, meaning anyone on your team can create charts and graphs for their needs. After building a chart, you can embed it on any WordPress page or post. The chart will automatically recalculate on page load whenever new data comes in through the attached Gravity Form.
Price: There are several GFChart licenses available starting at $69/year. Keep in mind, however, that you also need a Gravity Forms license.
2. wpDataTables
wpDataTables is one of the most popular WordPress report builder plugins. It allows you to build templates for your reports and then export those reports in various formats without any coding knowledge. . This is useful for businesses that need to save their reports as files to be distributed via email throughout their organization or to third parties.
Additionally, wpDataTables allows you to create responsive graphs to display on your pages and posts. You can even create tables that your user can edit on the page or post, thereby adjusting the charts in real time.
Since the plugin uses the Google Charts engine, it can accept data from a number of sources, such as Excel sheets, CSV data formats, JavaScript Object Notation (JSON), XML, and Serialized PHP arrays. Or you can simply type data into the editor.
That said, there’s one common complaint about wpDataTables that we would be remiss not to mention: Many users report that it’s quite complex. The documentation is robust, but you will need to explore a lot of it to create your reports properly. Make sure not to skip the setup wizard or you might miss key configuration steps.
Price: While there is a free version of wpDataTables, you need the premium upgrade to create professional reports. That costs $59/year.
3. WP Business Intelligence
WP Business Intelligence is a sophisticated reporting plugin for building your own business intelligence platform on WordPress. It allows you to create charts, graphs, and tables with a live connection to your database. You can display data visualizations for business intelligence dashboards, internal or public reporting, public relations, and just about anything else.
In order to use this WordPress report builder plugin, the data for your reports must be stored somewhere in your WordPress database. This makes the plugin flexible, but difficult for users who don’t know how to write MySQL or understand how databases work.
With WP Business Intelligence, you only have access to four chart types. You can gain access to seven more by purchasing the pro license, which also gives you options to filter, sort, and paginate database query results for easier data management and display. However, the pro license is exceedingly expensive for small businesses and only right for companies who have a significant budget for data reporting.
Price: The Lite version of the plugin is free, but you can upgrade to the Pro version starting at $599.
4. Gravity PDF
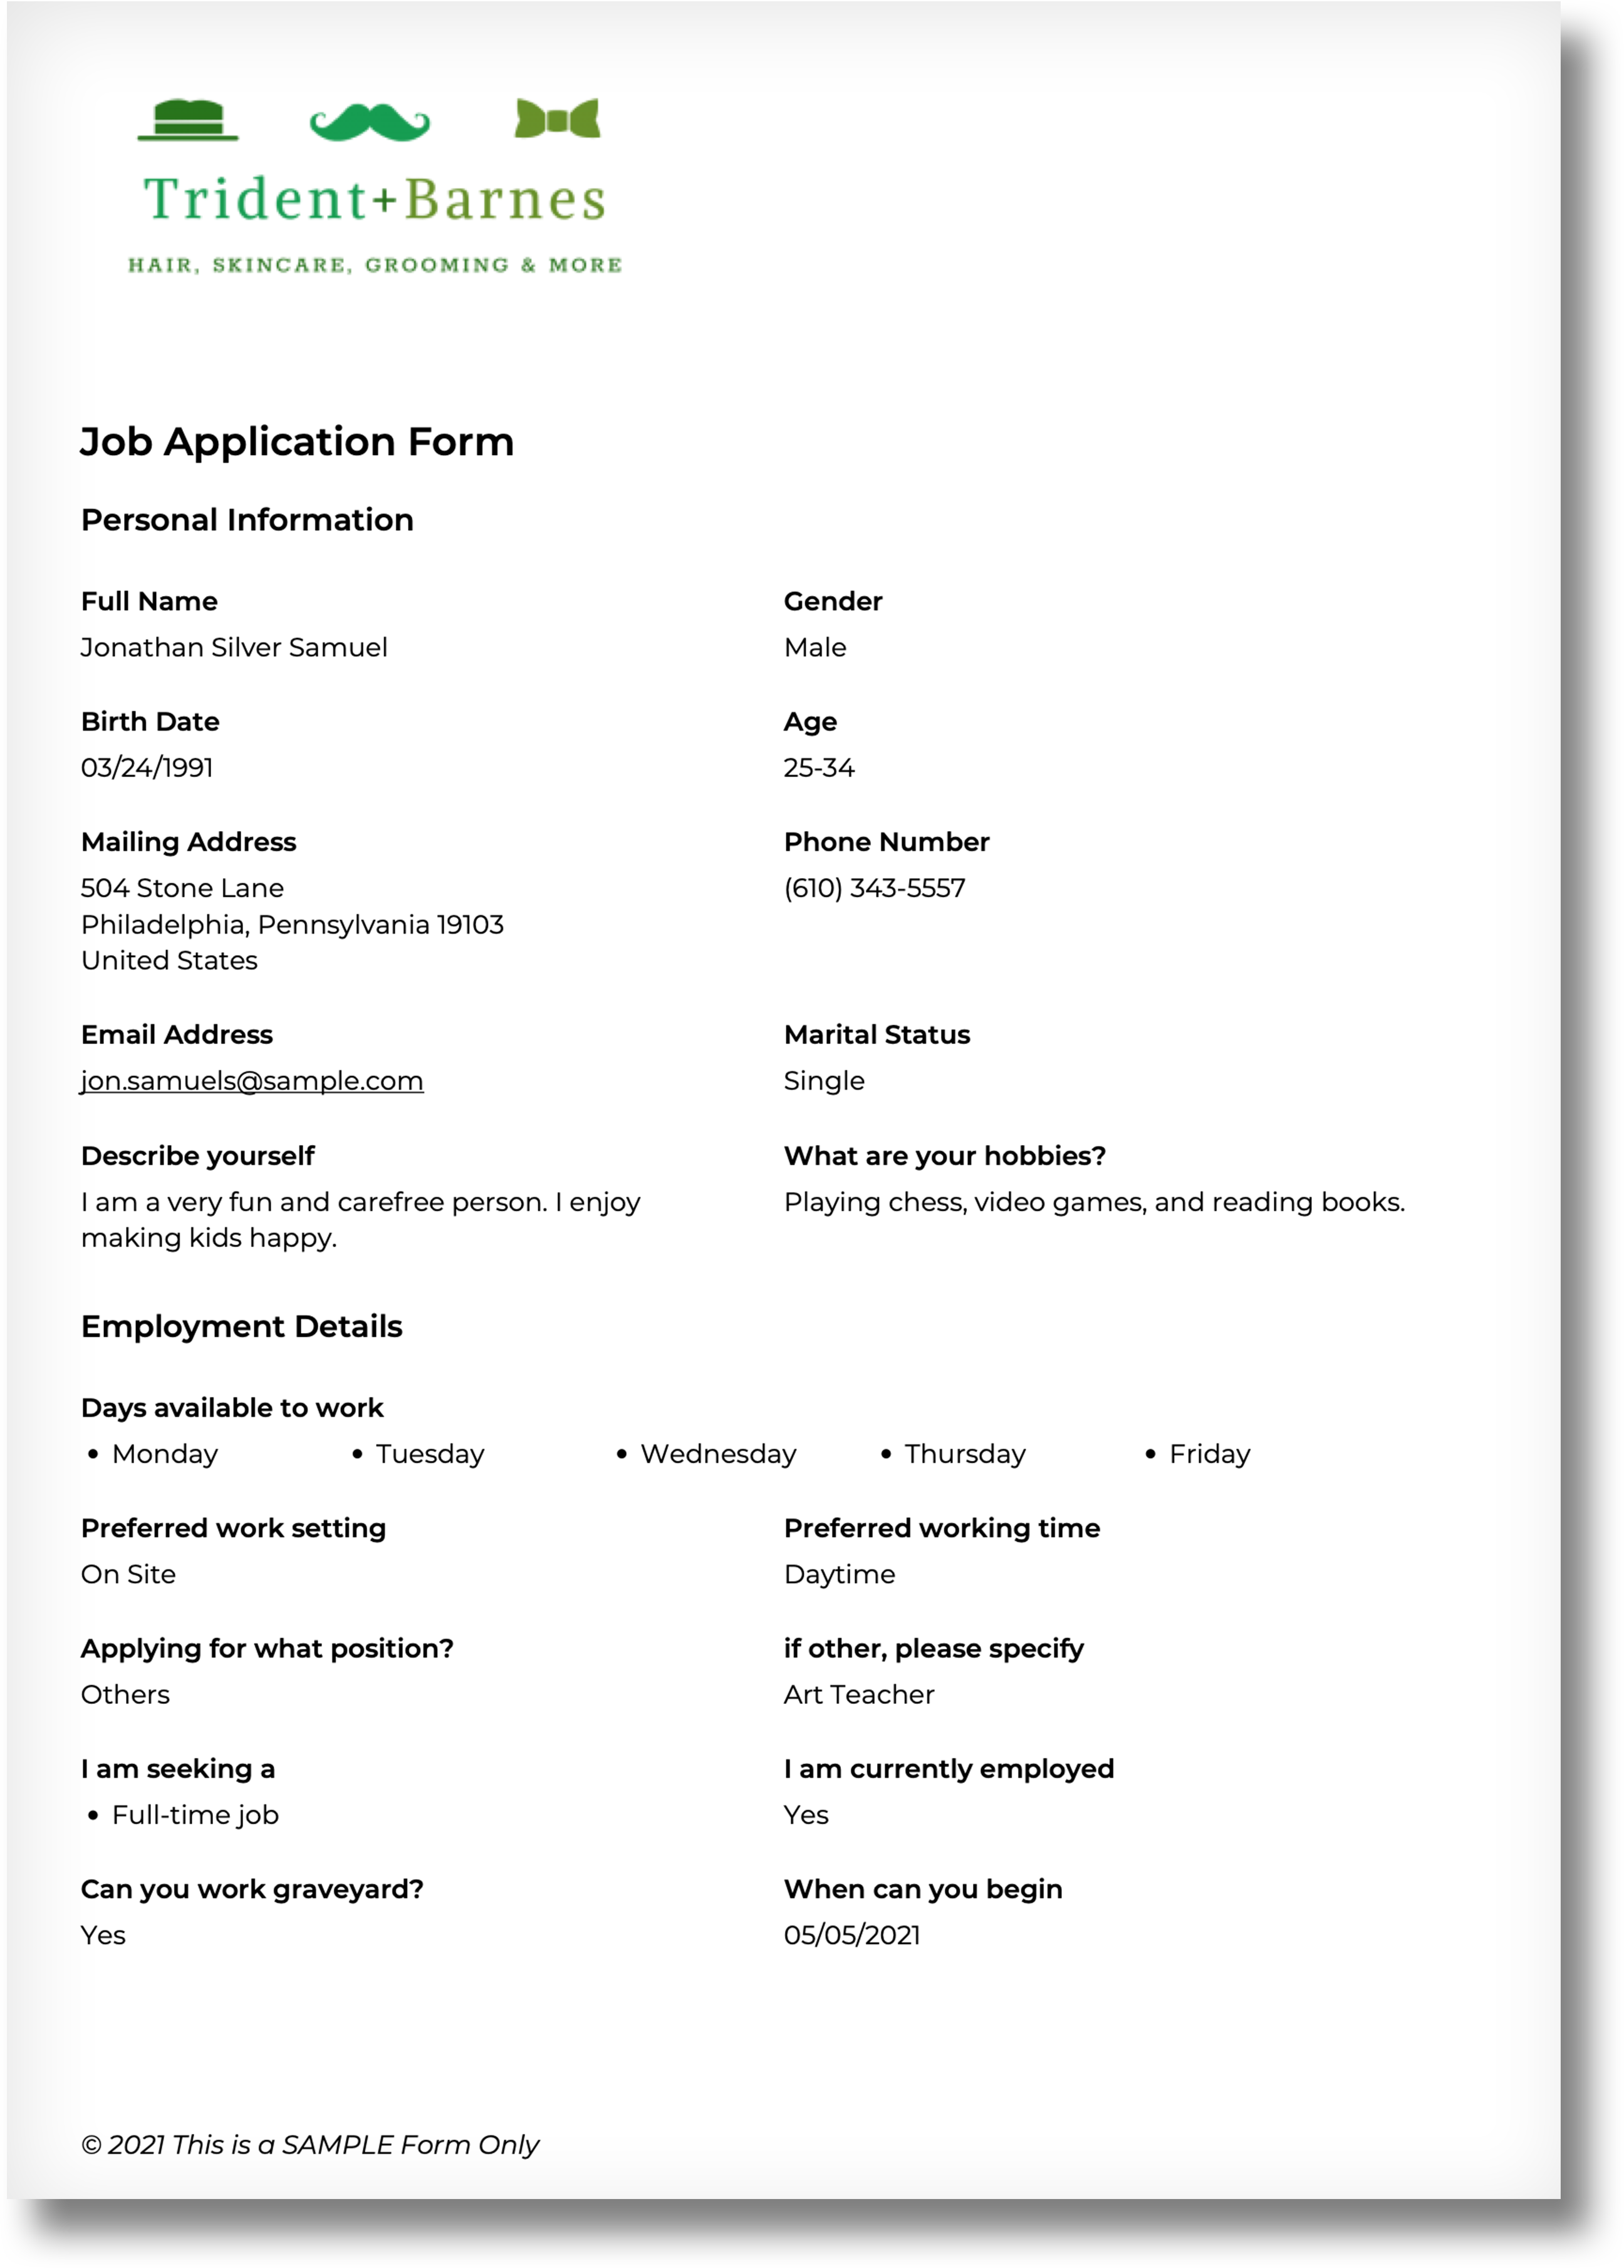
Gravity PDF is a unique WordPress report builder plugin that lets you generate PDF reports from Gravity Forms data. It’s a self-hosted solution for dynamically creating digital PDF documents using WordPress.

Using Gravity PDF is simple: Select one of the plugins highly-customizable PDF designs and personalize it with your company’s logo, header, footer, paper size, orientation, fonts, and colors. If you don’t find a template you like, you can obtain some options in their template shop, design your own from scratch, or ask the plugin creators to design one for you. Finally, you just need to map the fields of a Gravity Form to the fields on the report.
One thing we love about Gravity PDF is the ability to automatically email your PDF when a user completes a form. Have it emailed to people in your organization, the user, or both. You can also conditionally generate and email the PDF. If you combine this feature with a payment add-on, you can even sell your custom reports. This plugin also integrates with GFChart to enable charts and calculations in your PDF reports.
Price: Gravity PDF is free, but they charge for extensions and templates.
5. UberChart
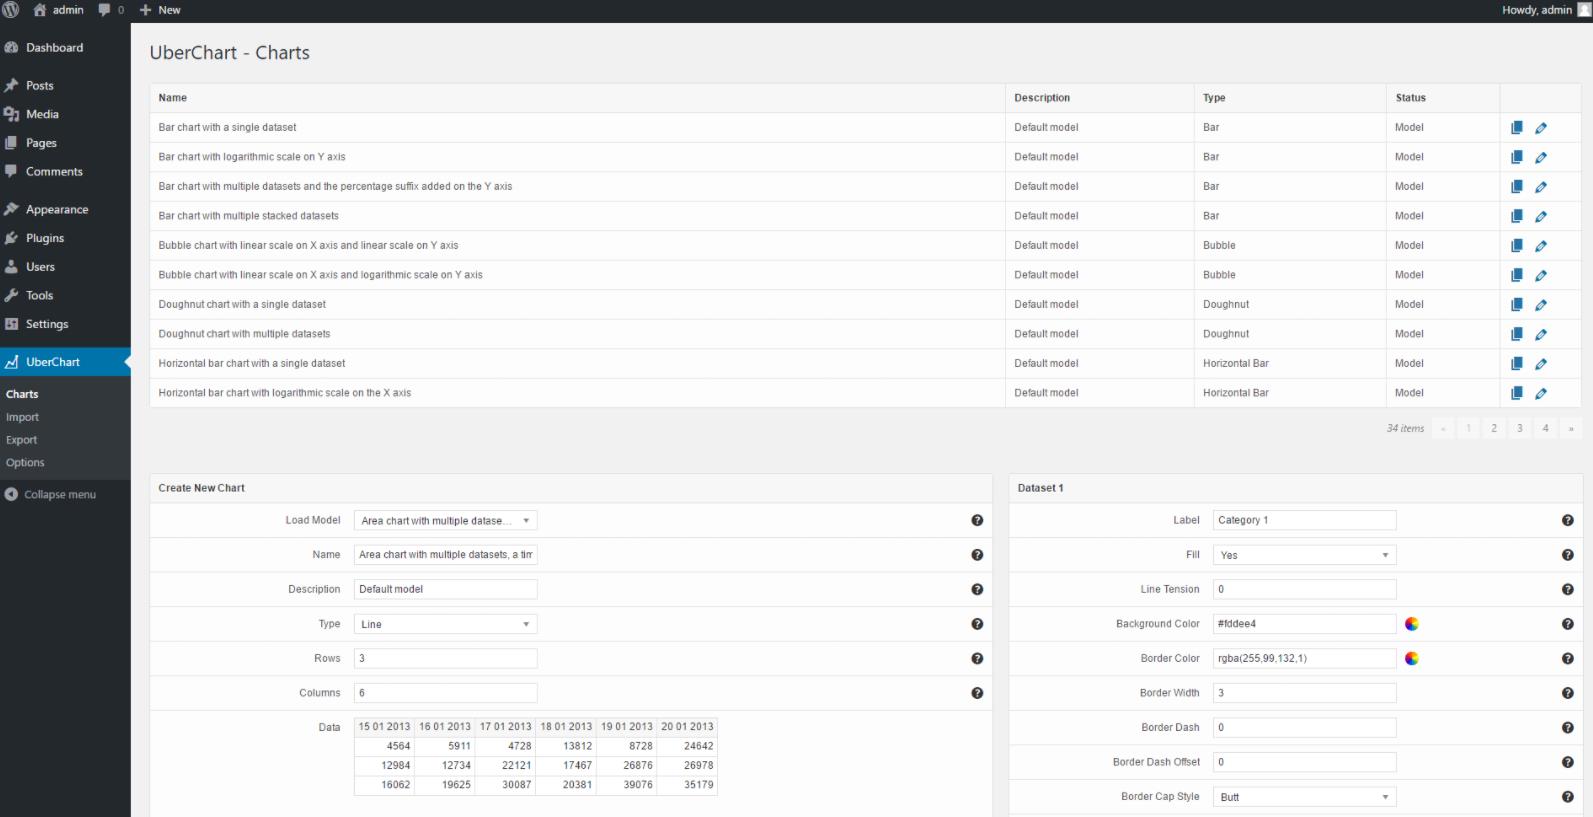
UberChart WordPress report builder plugin is a powerful tool to create advanced and professional reports without writing any code. It offers 10 chart types: Line charts, radar charts, area charts, polar area charts, pie charts, doughnut charts, bar charts, horizontal bar charts, scatter graphs, and bubble charts. Charts are fully responsive and display attractively on every device.
Configuring your charts is simple: The plugin offers a backend spreadsheet editor. You can also upload your data from other sources, such as Open Office, Excel, XML, and Google Spreadsheets.

One thing we like about this reporting plugin is the number of customization options it offers. You have access to 240 customization options per chart, including full control over the axis and scale of your charts. With a little bit of work, you can produce some stunning reports.
Price: There is no free option for this plugin. It costs $39 from Codecanyon.
6. Exports and Report
Like other plugins, this one can be used to retrieve data from your MySQL database to create reports. However, there is no graphing or charting feature, so your reports can only display raw, visualized data.
With Exports and Reports, you simply create a report, place it into a “group”, and export the data in the desired format. This is especially useful for client reports.
All you have to do after installing the plugin is to create a group (such as “clients” or “sales reports”) and then create a report within that group. Reports can filter by date, use pagination, score specific fields, and more. They can be exported as CSV, JSON,text (pipe-separated values), XLSX, PDF, TSV, XML, and custom types.
Price: Free
Final Thoughts on the Best WordPress Report Builder Plugins
That’s our list of the best WordPress report builder plugins. Use one or several of the tools from our list to turn your data into attractive reports that you, your customers, leaders, co-workers, stakeholders, and audience find valuable. With a well-designed report, you’ll be able find the hidden meaning within your data to make smart decisions.
