
Surveys are powerful tools that help you understand how a group or audience feels about a particular topic. They turn qualitative data into quantitative data. Without having dozens or hundreds of one-on-one conversations, you can look at the aggregate.
There are countless ways to use surveys. You might ask your readers about their favorite topics. You could ask your subscribers for their thoughts on your membership course. Or you might query your employees about the state of your workplace culture. They’re useful for market research, customer onboarding, product feedback, brand awareness, and much more.
This tutorial teaches you how to create a survey using Gravity Forms. Then we show you how to create a live report of your survey data using GFChart.
Surveys turn qualitative data into quantitative data. You can look at the aggregate without having dozens or hundreds of one-on-one conversations. Share on XHow to Create a Survey
First, let’s walk through the process of creating a survey.
Step 1: Install Gravity Forms and the Survey Add-On
Before creating the survey, you will need to install a few plugins. If you haven’t already, download and install Gravity Forms. You’ll need the Elite License to gain access to the Gravity Forms Survey Add-On. This add-on offers eight survey field types and will do the heavy lifting for your survey form, so it’s essential.
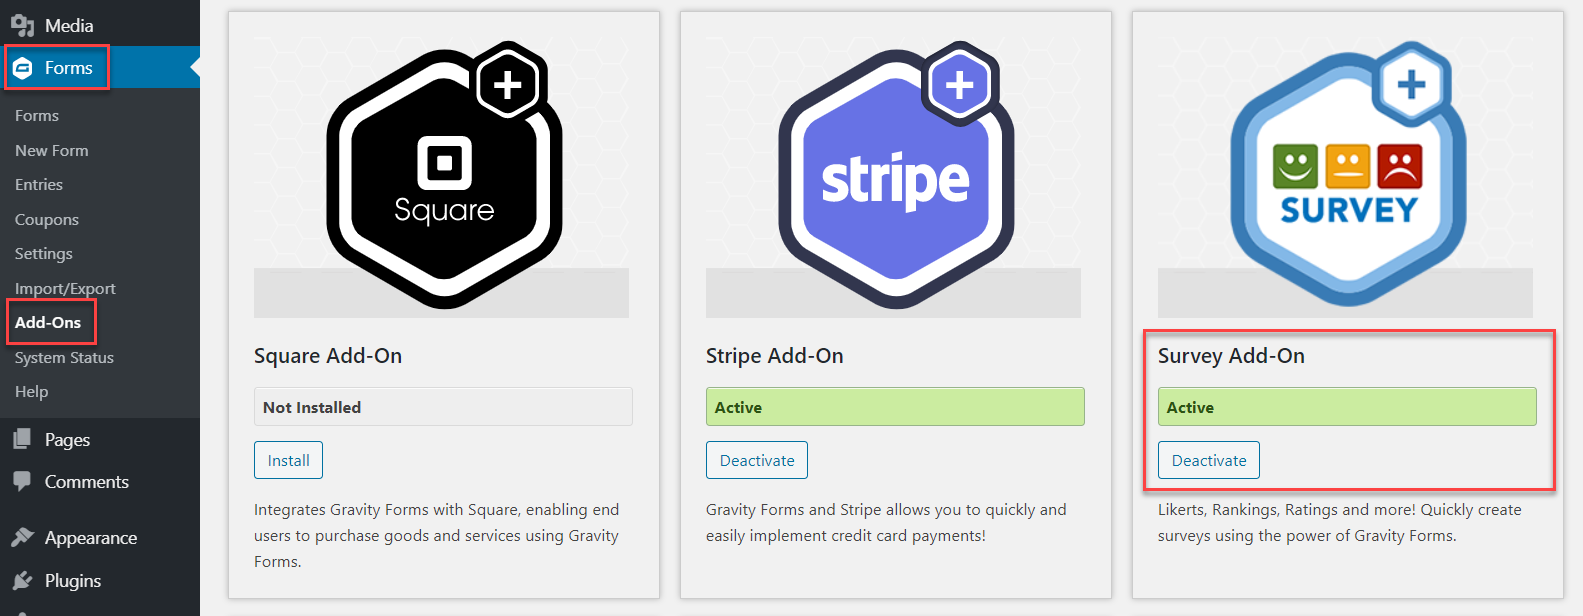
To install the Survey Add-On visit Forms > Add-Ons from the left-hand menu of your WordPress dashboard. Find the Survey Add-On on the list and click on Install.
Step 2: Create a New Form
Click on Forms > Add New Form to open a new form. Give it a name that distinguishes it from other forms on your website. You can also give it a description if you like, though this is optional.
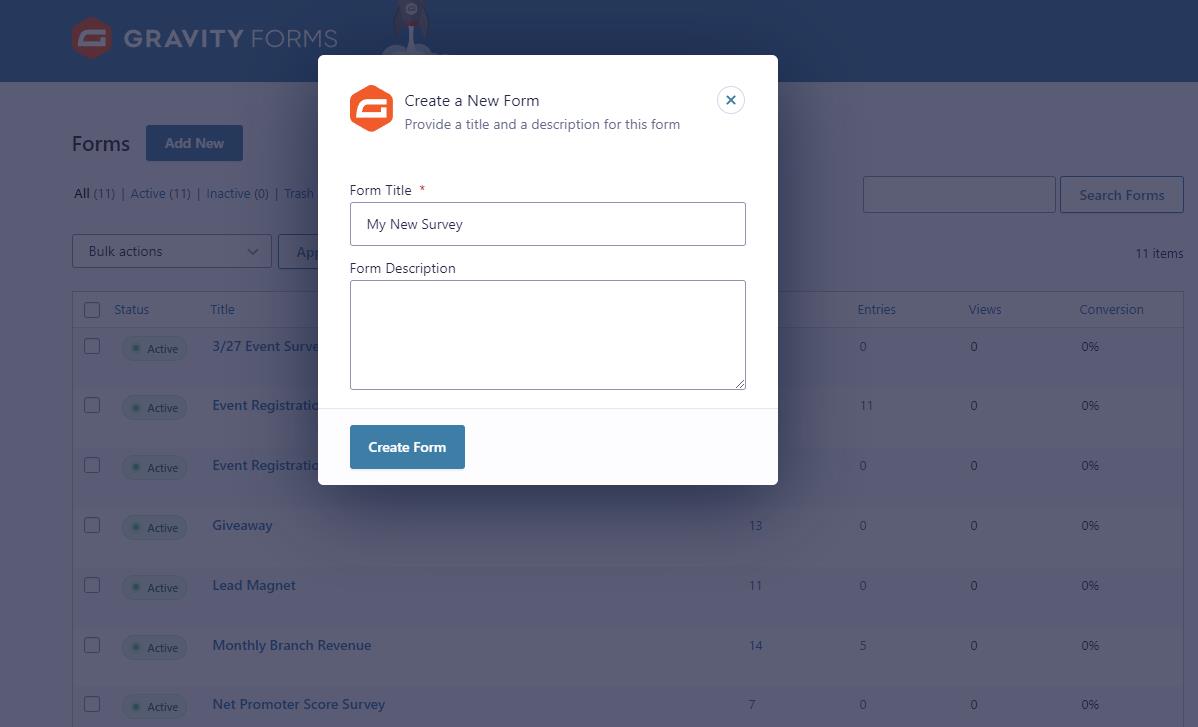
(If you want a shortcut for these instructions, visit Gravity Forms’ template library and download their pre-built survey template, then simply import it to your website. Once imported, you can customize the form for your exact needs.)
Step 3: Add Fields to Your Form
Now, it’s time to add fields to your form. Before you start adding survey fields, though, you’ll probably want to add some generic fields that every form needs, such as Name and Email. Depending on the nature of your business and your needs, you might want to include other fields to capture information from your survey takers.
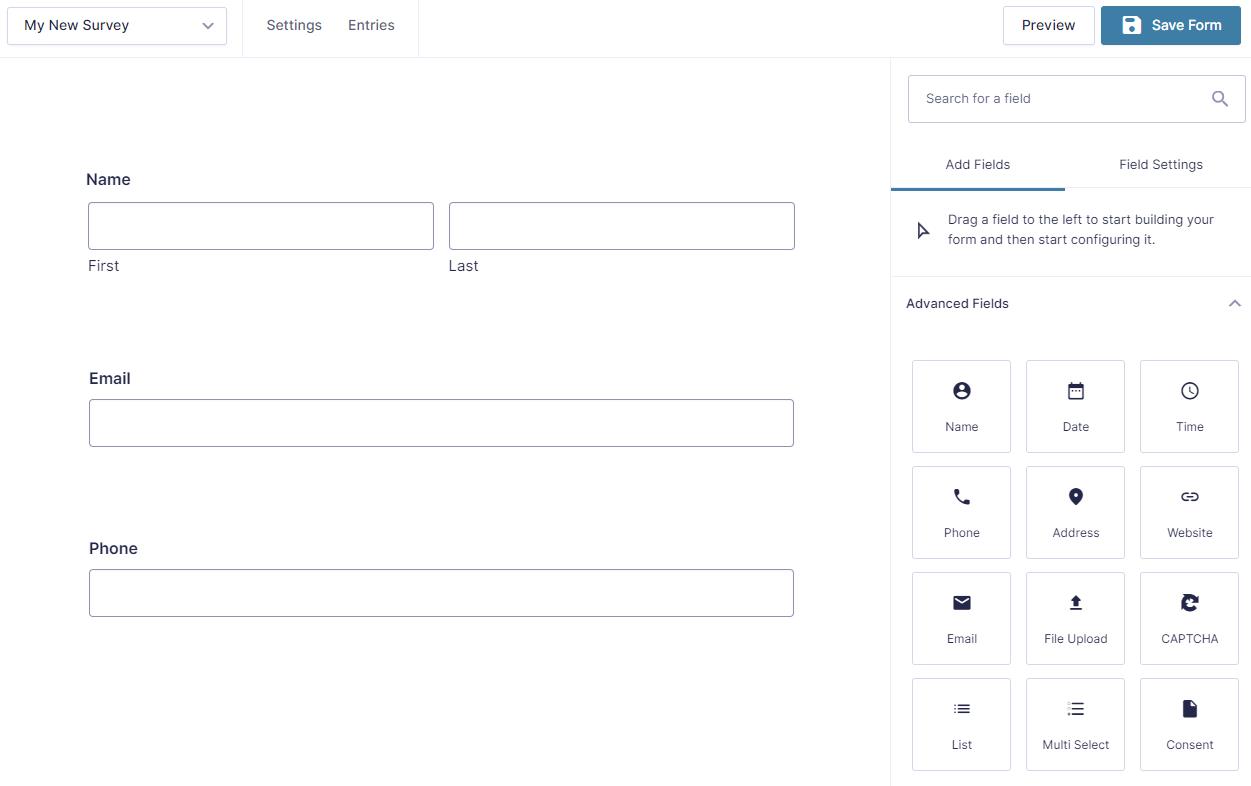
Now it’s time to add some survey-related questions. Add Survey fields from the bank of Advanced fields on the right.
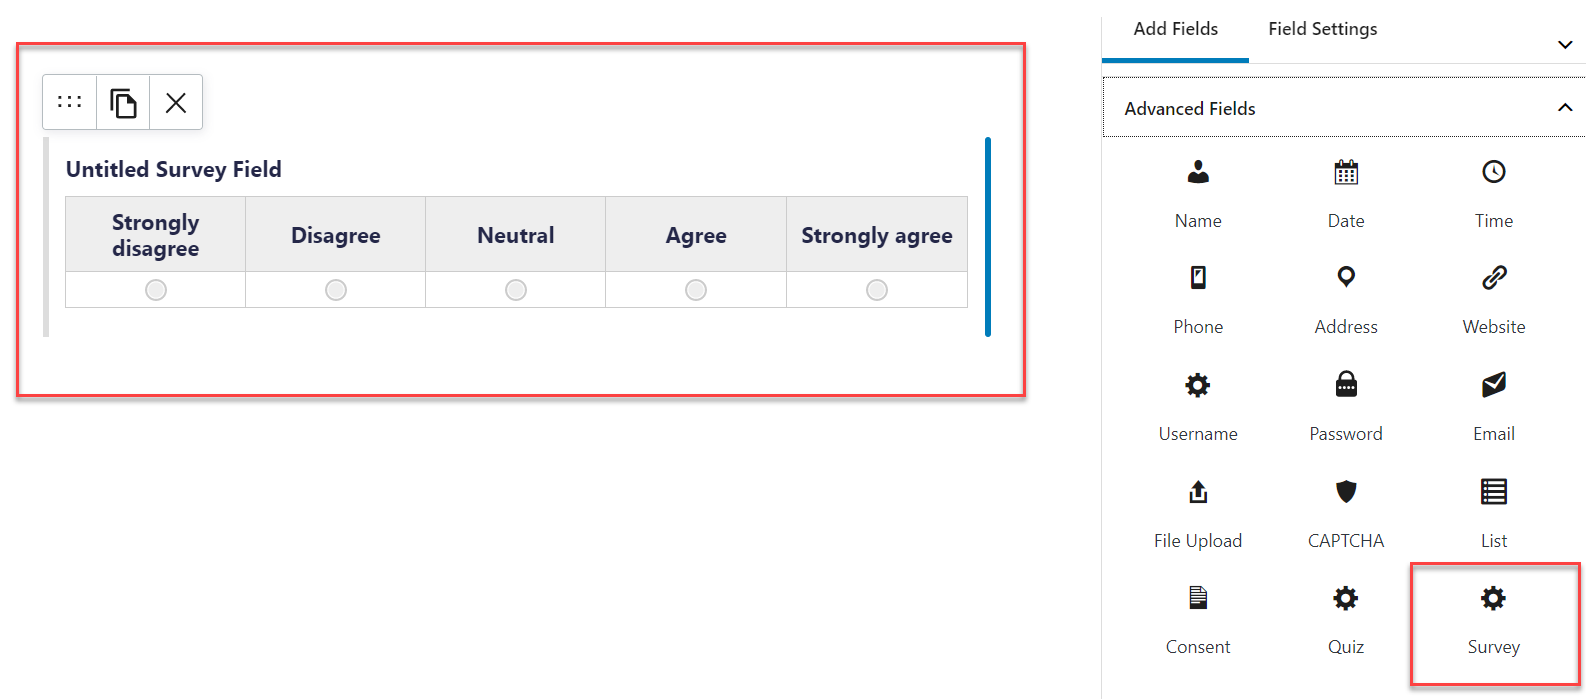
Gravity Forms offers eight survey field question types:
- Likert: Users can choose one from a scale (e.g., strongly disagree to strongly agree) *
- Rank: Users can rank options in their own order.
- Rating: Users can choose a star rating.
- Radio Boxes: Users can select one option from a set.
- Checkboxes: Users can select multiple options.
- Dropdown: Users can select from several dropdown options.
- Single Line Text: Users can input a single line of text.
- Paragraph Text: Users can input multiple lines of text.
* (Currently, GFChart is only compatible with “single row” likerts – not multiple row.)
After adding a field, configure it by adjusting the settings in the right column. You’ll need to select a type, insert a question, and then supply the options for answers. Browse the Appearance and Advanced tabs at the top of the field editor to configure other settings. Like most Gravity Forms fields, you can use conditional logic and dynamically populated data.
Once you’re finished adding fields, click Update to save your form.
Step 4: Configure Notifications and Confirmations
Visit the form’s confirmation and notification settings to adjust how users and people on your team are notified about the survey’s use.
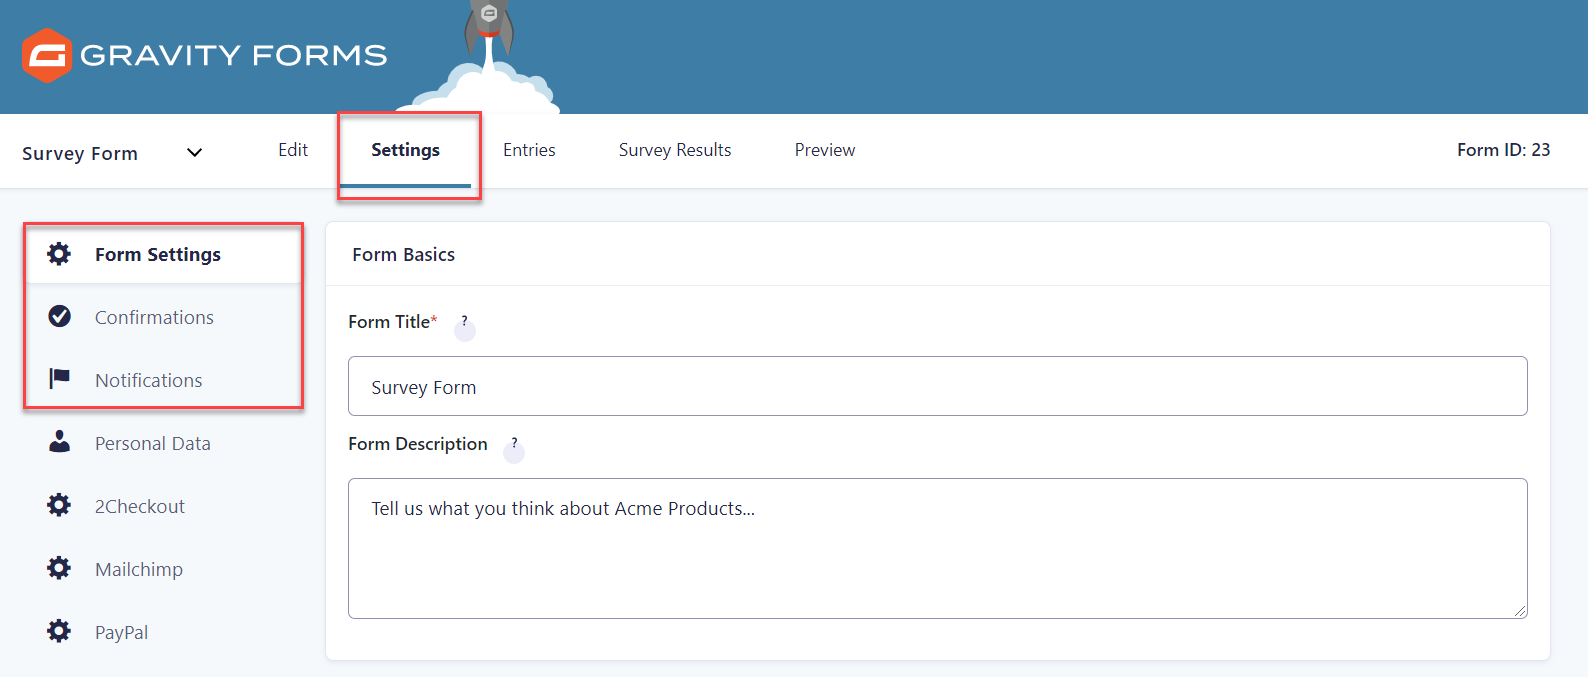
Under Confirmations, you can edit the on-page message that users see when they complete the survey. Change the default confirmation to something like, “Thanks for completing the survey! We’ll respond to you shortly.”
Under Notifications, change or add email addresses that WordPress sends out when someone submits the survey. The current admin will receive an email by default, but you can change this to whomever you like. We recommend creating an email that notifies the survey taker, as well.
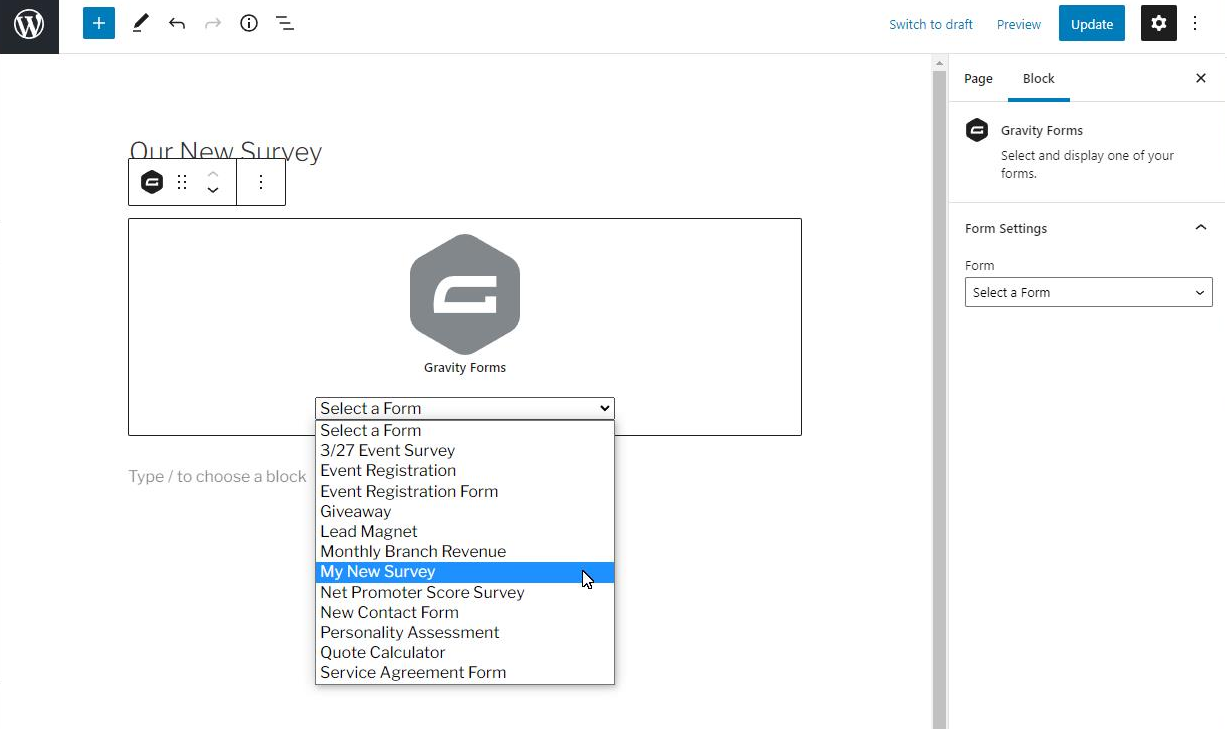
Step 5: Embed the Survey on Page
Now that your survey is ready to be used, your next step is to make it available on a page. Visit the Gutenberg editor of any page or post where you want the form to appear. Add the Gravity Forms Block and select your survey from the drop-down list.
How to Display Survey Results
If you have survey responses flowing in, you may want to display the results on a page or post for your team or your audience to review. But rows and columns of data don’t help anyone. Instead, it’s best to display your survey results using charts and graphs.
To display your survey data as a live report, you’ll need to download and install GFChart. GFChart is a data visualization plugin that you’ll use to make attractive charts and graphs from your Gravity Forms data.
A GFChart isn’t just pretty. It’s also accurate. The chart is built from Gravity Forms entries upon each page load, so it’s always using the latest submission data. You could load it onto a page and check it every day to keep tabs on your survey results or build a complete dashboard.
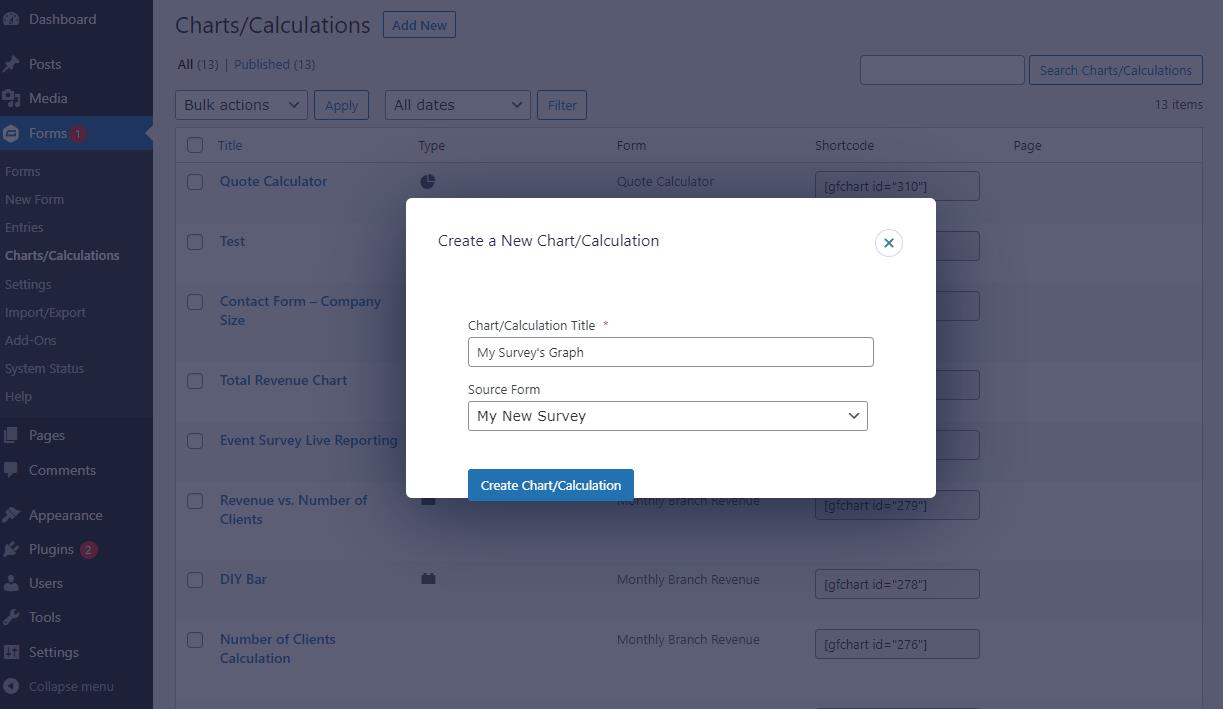
Building Your Chart
To create a GFChart, visit Forms > Charts/Calculations in your WordPress dashboard. Then at the top of the page, click Add New. Give your chart a name and choose the form that will supply data (in this case, our recent survey form), and click Create Chart/Calculation to dive in.
Inside the chart editor, you’ll notice several chart options. Since your survey form asks multiple questions, you’ll need to create a chart for each question you want to display on your site. Consider which of the available chart/calculation types is suitable for the question you intend to chart.
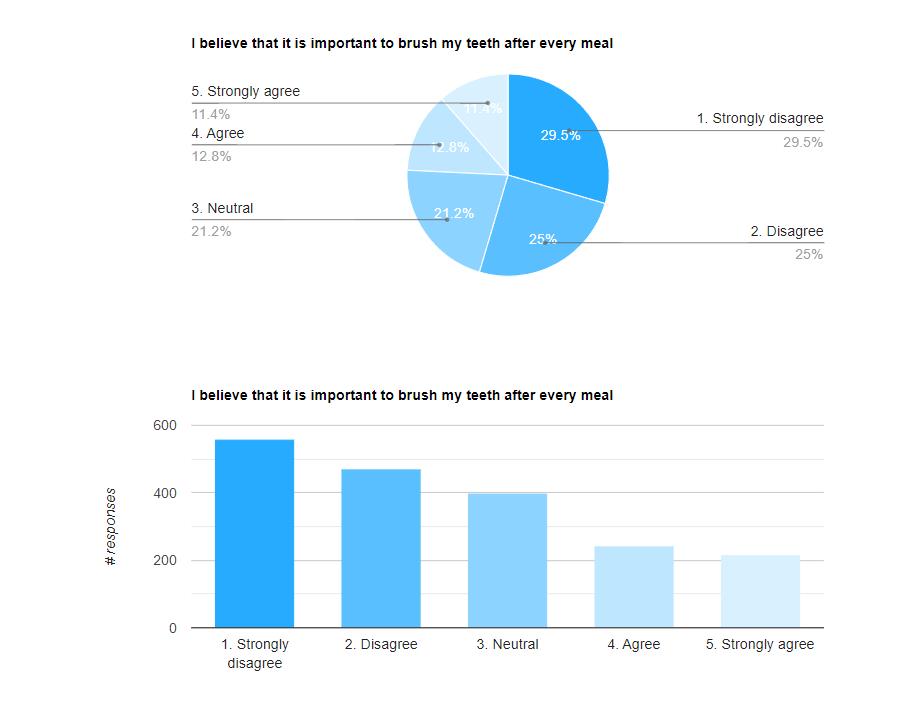
For instance, let’s say your first question is a Likert field that says, “I believe that it is important to brush my teeth after every meal.” The options are: strongly agree, agree, neutral, disagree, and strongly disagree. In this case, it makes the most sense to use a bar graph in the Design tab.
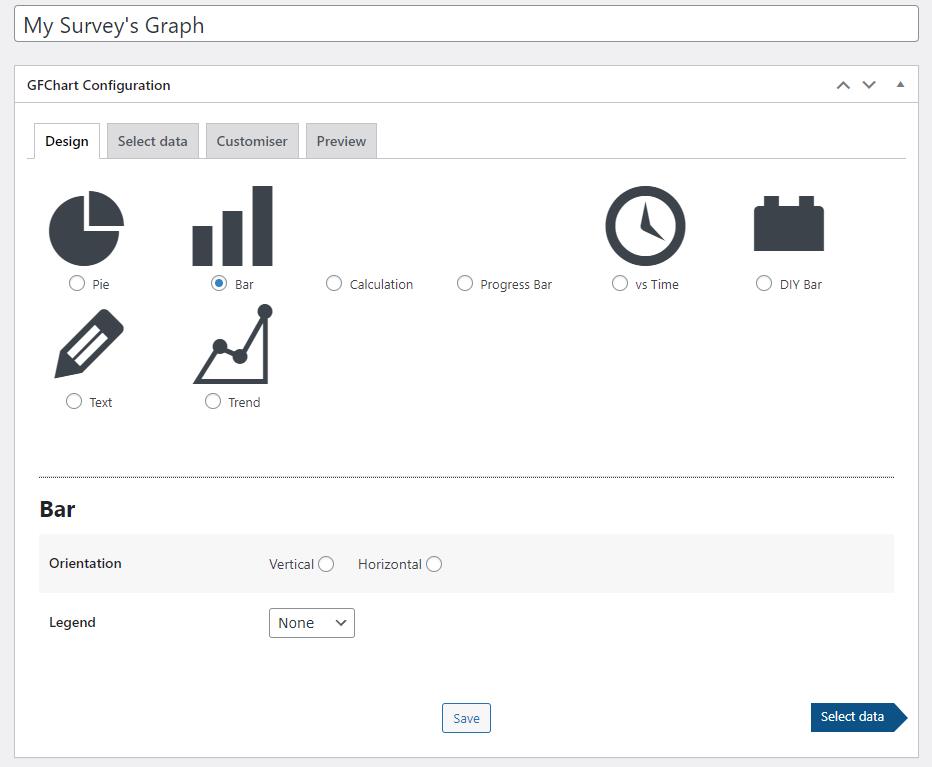
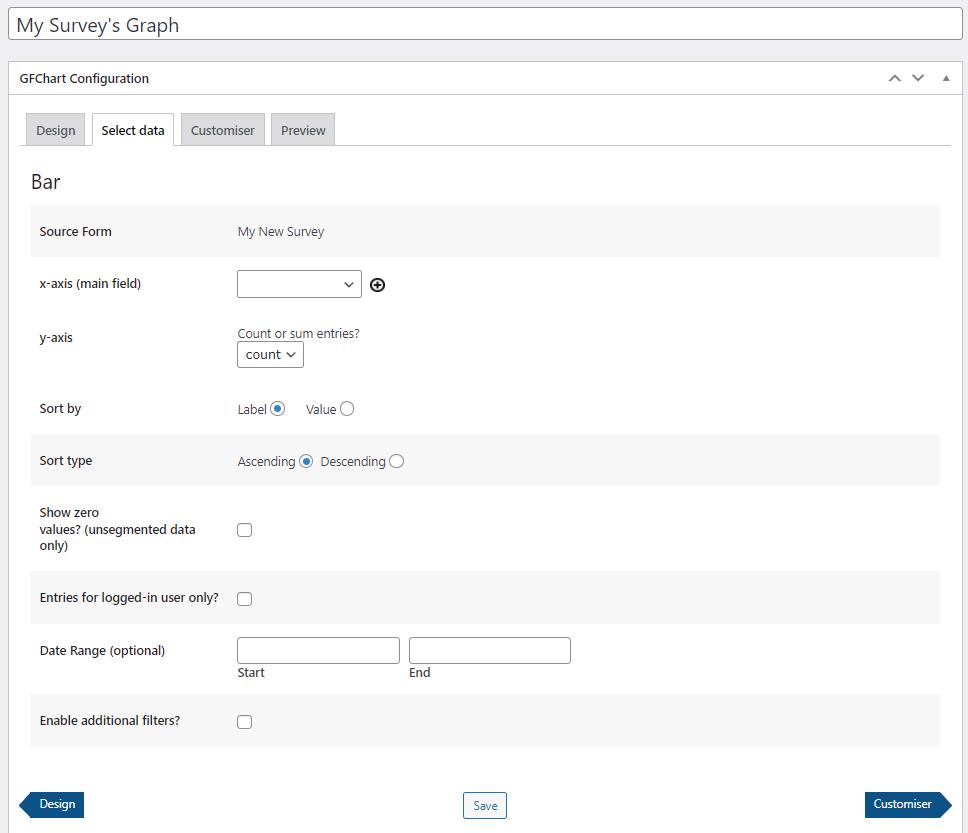
The Select Data tab is where you’ll map your questions to the graph. In the case of a bar graph, you’ll need to define the X and Y axes. Other chart types will have different requirements, so go through these settings carefully.
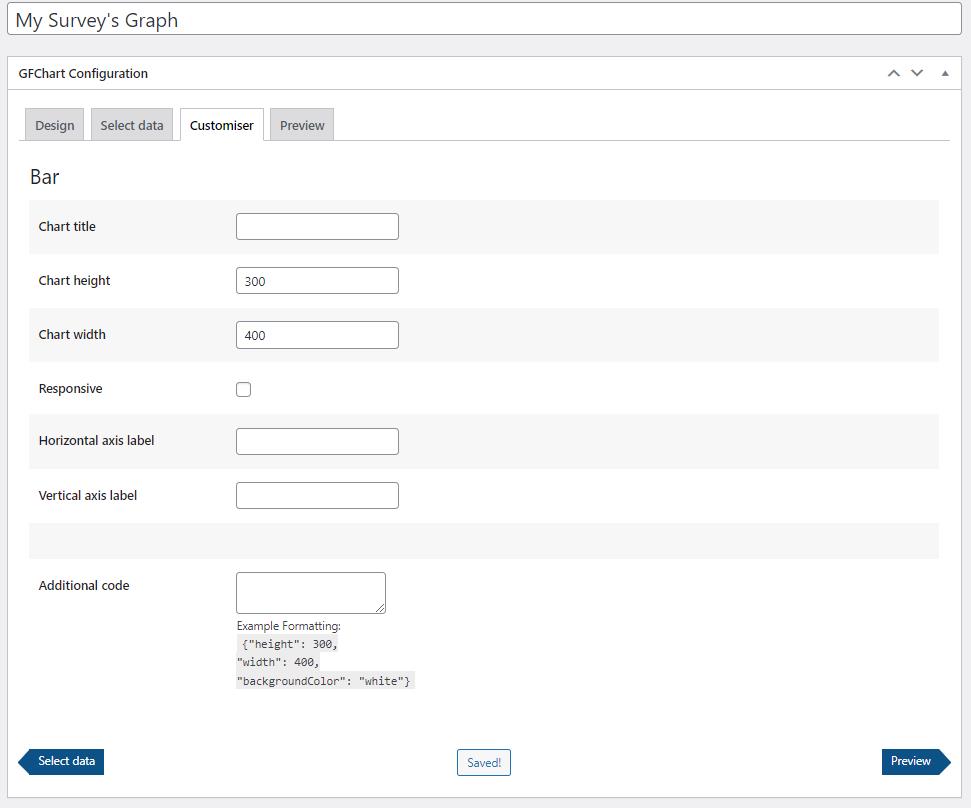
The Customiser tab is your opportunity to customize the appearance of your new chart. You can adjust the size, responsiveness, and labels. You can also add custom CSS to make the chart genuinely unique.
Finally, the Preview tab is where you can view the final product. If you aren’t happy with the output, go back through the previous tabs to make any adjustments.
Displaying your chart
The next step is to display your data visualization on a page for others to see. Fortunately, this is relatively easy. You can embed a GFChart on a page or post the same way you embed a Gravity Form using a Gutenberg block. Find the Chart block in your Gutenberg editor, add it to your page/post, and select the survey form you just created from the drop-down list.
Below is an example of the final output. Notice how you can instantly recognize how most people feel about a particular issue. Most importantly, the data is always up-to-date. The output looks like this. (For more samples, see our sample output page.)
Going Forward
Surveys are an effective way to learn about groups of people, yet many businesses neglect to use them. With Gravity Forms and GFChart, you can create attractive and high-converting surveys that gather powerful data. You can use this information to boost your sales, grow your audience, and improve your relationship with your team or stakeholders.