How To Create Engaging Charts and Graphs With Your Data in WordPress
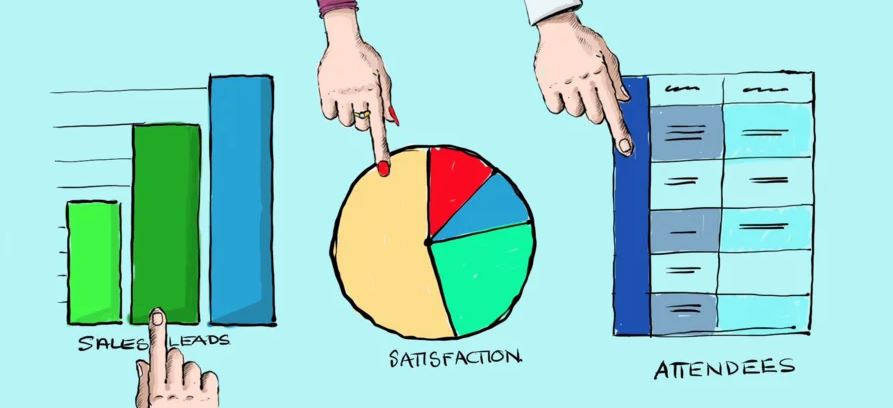
If you collect data from customer enquiry forms, surveys, booking requests, or quizzes, then you’ll understand that the data alone can be difficult to interpret until you see it in graphs and charts.
Until then, that data is just numbers and words on a page or spreadsheet.

