
The web is full of top 10 lists. They might be a little cliche, but readers love them, and content creators love to produce them. What makes them so great?
- Reading them is fast and easy, which is vital in an age where we’re unwilling to read entire articles.
- You can scan them quickly, which means readers can focus on the parts of the content that matter to them the most.
- Numbers in headlines drive higher responses. This fact is most likely because of the implied comprehensiveness and expertise.
- They create structure and organization for readers to follow.
- They’re faster and easier for creators to write due to their modular nature.
- They serve as a launch point for additional articles.
But how do you choose the items for your top 10 list? Do you select items randomly? Do you pick the ones that matter the most to you? These options are how most top 10 lists are created, but there’s a better way: User-generated content.
User-generated content is when you ask your audience to create – or help you create – the content. Doing this makes your content more accurate, relatable, and engaging for your audience. They’ll know it’s true because they can see the results from users just like them.
This article shows you how to create a top list from user-generated content using Gravity Forms and GFChart.
The web is full of top 10 lists. They might be a little cliche, but readers love them, and content creators love to produce them. Share on XStep 1. Install the Necessary Plugins
Before you get started, you’ll need to install two plugins: Gravity Forms and GFChart. We’ll use Gravity Forms to build a form for users to submit data. Then we’ll use GFChart to display that data on a live page so your audience can see the results.
If you’ve never installed a WordPress plugin before, check out this guide.
Step 2. Create a New Form
We will use Gravity Forms to collect data from your users, so the first step is to create the form. For this example, we poll users on their favorite digital marketing technique.
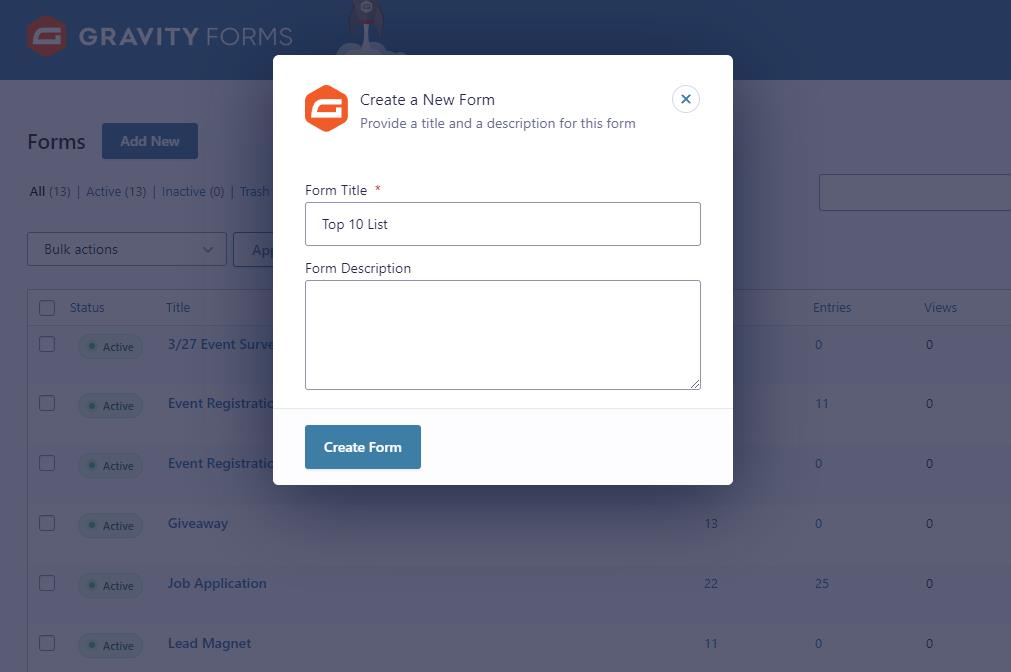
In your WordPress back end, click Forms > New Form. A popup overlay will appear. Give your form a name that distinguishes it from other forms.
Step 3: Customize the Form Fields
We always recommend starting a form with Name and Email fields. This way you can contact the submitters in the future. You could integrate this form with your email marketing tool to start building an email list.
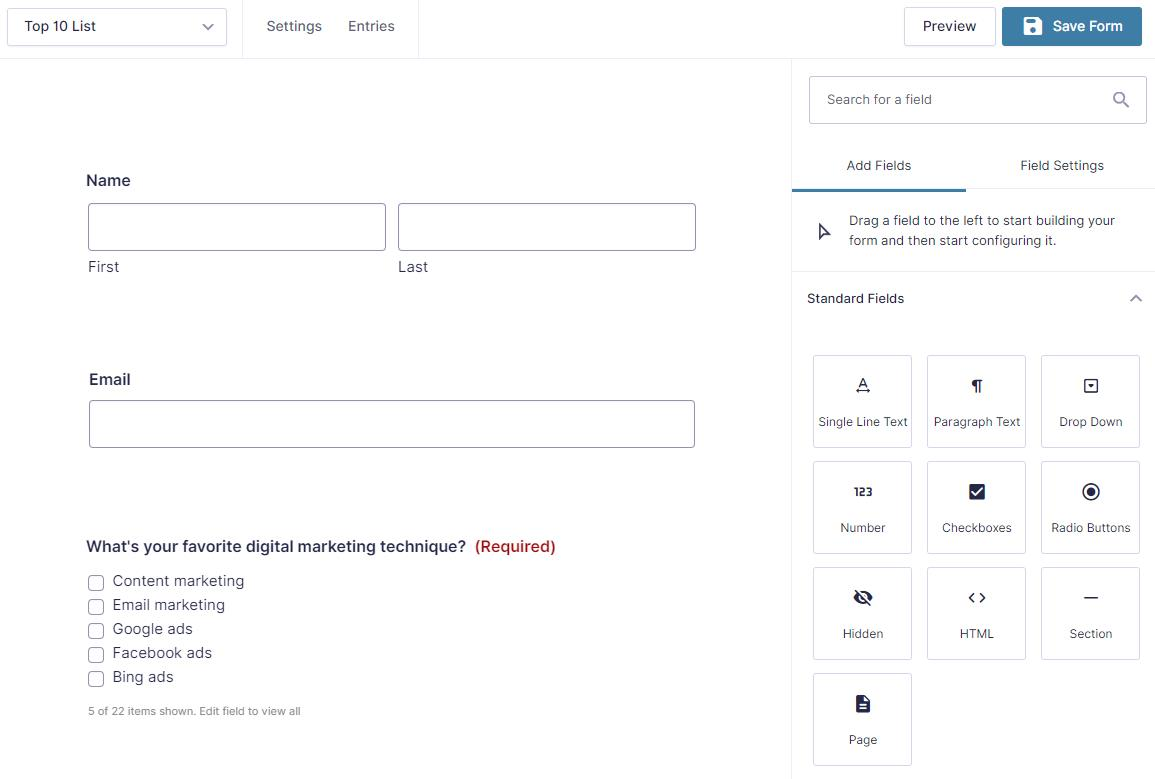
The third field will be the primary question of our poll: “What’s your favorite digital marketing technique?” Use a checkbox field so users can make multiple choices simultaneously.

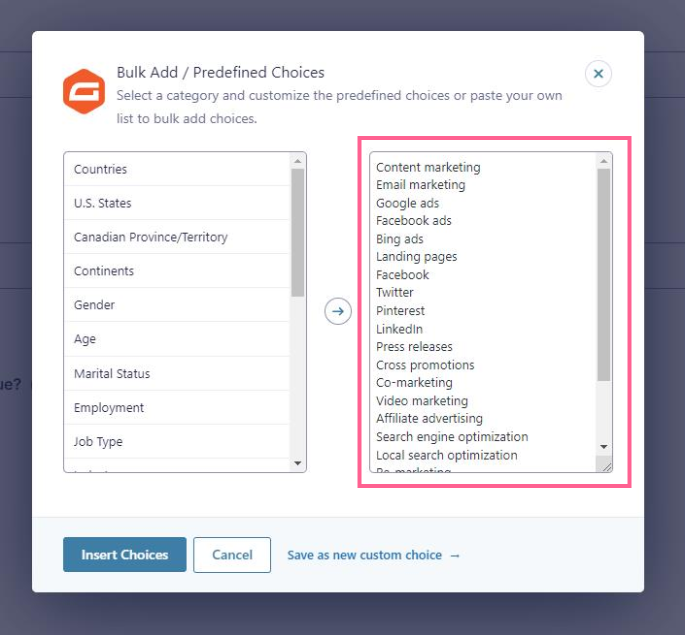
Give your users lots of potential choices so they have plenty of options to click. Obviously, you’ll need more than 10, so it might be easier to click the “Bulk Add / Predefined Choices” button and paste in a big list.
Make sure to mark each field as required. Then click the Save Form button to save it.
4. Add the Top 10 Form to a Page or Post
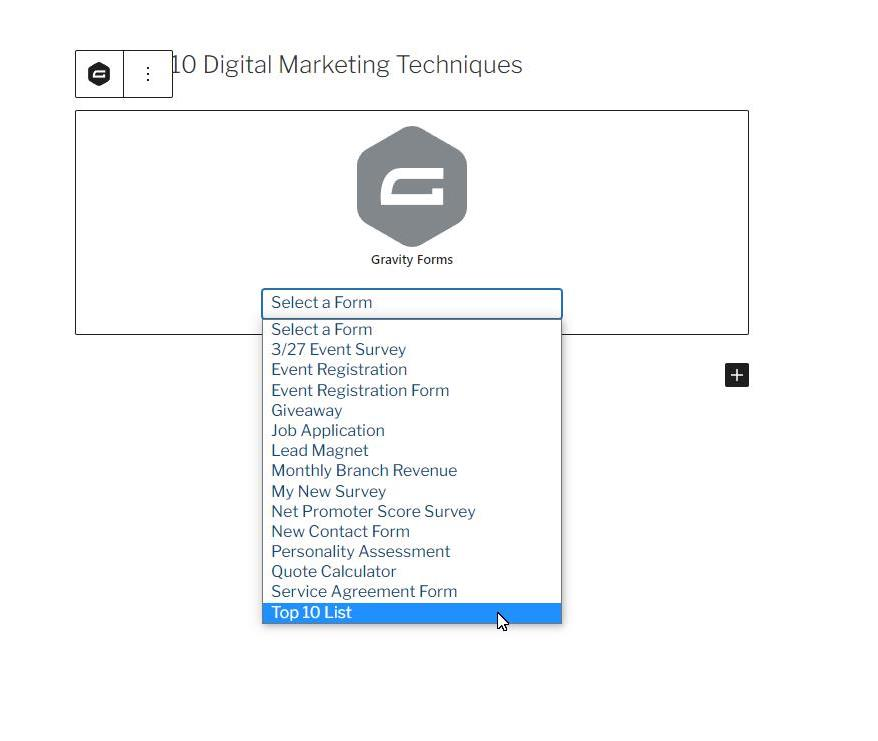
Now that your form is complete, you’ll need to add it to a page or post so your audience can find it. Visit the editor for the page/post where you want the form to appear and add the Gravity Forms block. Select the top 10 submission form you just created.
Click the Publish button to save the page. Now your form is live for your audience to start submitting their responses.
5. Create the Report
Once submissions start flowing into your form, it’s time to create the chart that will display the results. Your audience will see exactly how other people responded.
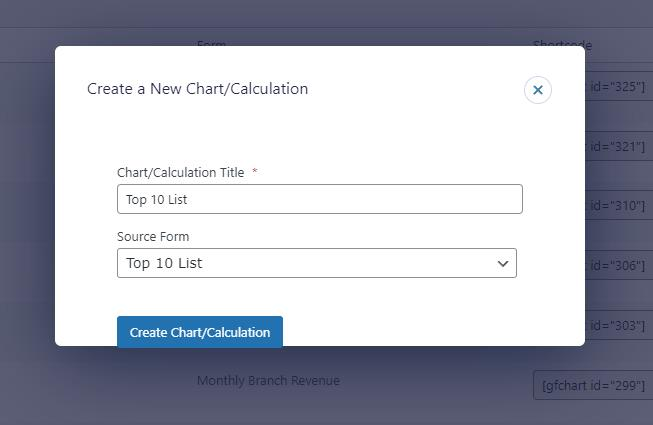
To create a chart, visit Forms > Charts/Calculations. Give your new chart a name that distinguishes it from other charts you might create. Then select the form that is the source of this chart (the Top 10 List form you just created).
The chart builder is divided into four tabs. On the Design tab, choose the type of chart you’d like to create. In this case, a bar chart or pie chart is most suitable. More options will appear below after selecting a chart type, such as the style or orientation.
The Select Data tab is where you map your form’s fields to the chart. If you’re using a pie chart, select the “What’s your favorite digital marketing technique?” in the Field drop-down. If you’re making a bar chart, set the same question as your X-axis and “count” as your Y-axis.
The Customiser tab is where you adjust the appearance of your chart. You can change the height and the width to match the content area of your site and even add custom CSS code to make the chart fit perfectly with your theme. These details aren’t necessary, but a few basic design tweaks can go a long way toward making your content look more professional.
The Preview tab is where you can preview your chart before publishing. Make sure the data is accurate. This preview will only show data if you have submissions, so you may need to submit the form a few times yourself just to get something for the chart to display. You can remove your fake submissions once you are happy with the chart.
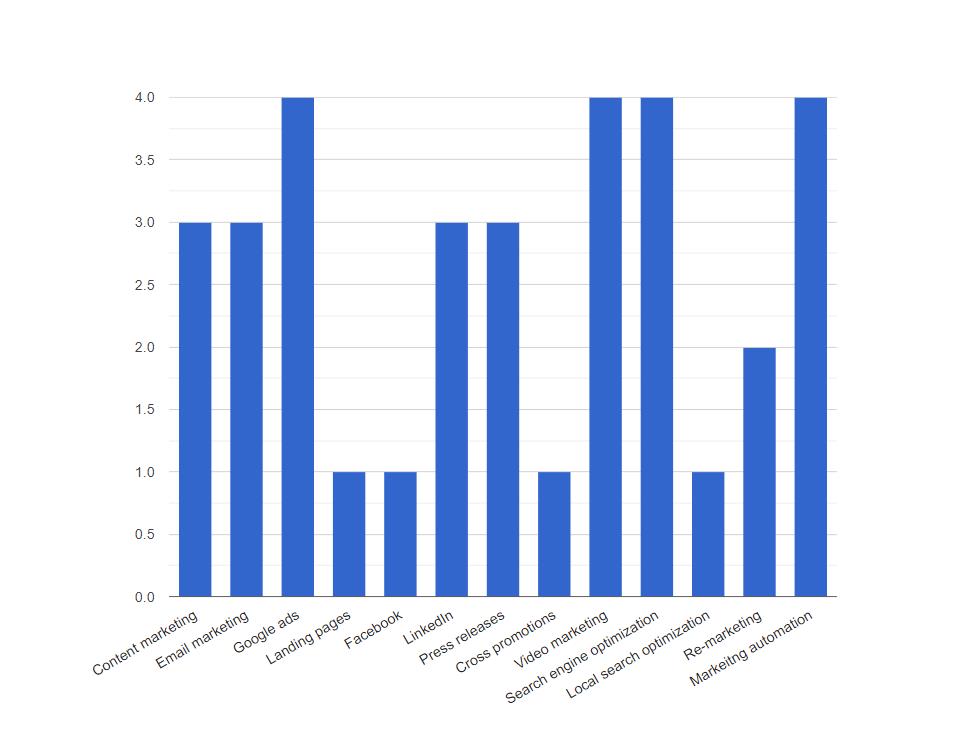
When it’s all done, you’ll end up with a chart that looks similar to this:
Once you’re satisfied with your chart, click Publish.
6. Add the Top 10 Chart to a Page or Post
The final step is to add your chart to a page for your audience to access. Simply visit the page or post where you want the chart to appear, and use the Chart block to publish your chart. You can place this chart on the same page as the form or on a different page.
7. Add Context to Your List
Once your chart is in place, it will always display the results of your form, giving your audience a real-time view of what their peers think. As more people submit the form, it will update with the new information.
Next, use this chart as a basis for your top 10 article. The article you craft should revolve around the results of the user-generated graph. For instance, if the most popular digital marketing technique (in the case of our example) was Google ads, it should be the first entry on your top 10 list.
The benefit here is that your audience can see that you aren’t just regurgitating other articles or boring them with your uninformed opinion. In this case, you know which items belong on your top 10 list because you have genuine data from your audience.
Going Forward
Adding a chart with user-generated data is a great way to add supporting resources to your top 10 lists. It adds a layer of authenticity that other content often lacks. If you can show your audience that your content is more accurate than other authors, they’ll start to see you as an honest solution provider that deserves their attention and their business.