
Gravity Forms is a powerful tool to collect data from your website visitors, but that data is locked away in the back end of your WordPress site. There’s no way to look at the data in aggregate, and it’s only available to people who have access to your WordPress site (which shouldn’t be many). This presents a serious challenge if you need to communicate that data – and the insights that come from it – to other people.
So you’ll need a way to report those submissions to your team, stakeholders, and audience in a way that’s valuable and meaningful. Furthermore, you’ll want to automate this process to always present data to the right people without manual intervention.
This article offers three simple ways to automate your Gravity Forms reporting. Use one or all of these options to produce reports that put your collected data in the hands of the right people at the right times.
Use one or all of these options to produce reports that put your collected data in the hands of the right people at the right times. Share on XOption 1: Create Graphs, Charts, and Visualizations
The best way to report your Gravity Forms data is with a visualization. Our brains struggle with rows and columns of raw data but excel when presented with illustrations that help us see the meaning behind the information. So if you want your audience (whoever that may be) to truly comprehend your data, you’ll want to display it as a chart or graph.
That sounds complicated, right? Fortunately, it’s quite simple. You can display your data as a visualization with the help of GFChart, a simple way to convert your Gravity Forms data into automated reports.
What makes them automated? Once you link a Gravity Form to a chart, you never have to touch it again. The chart will update whenever there is a new submission on the form. This automation means that you can quickly create a professional dashboard with just a few GFCharts.
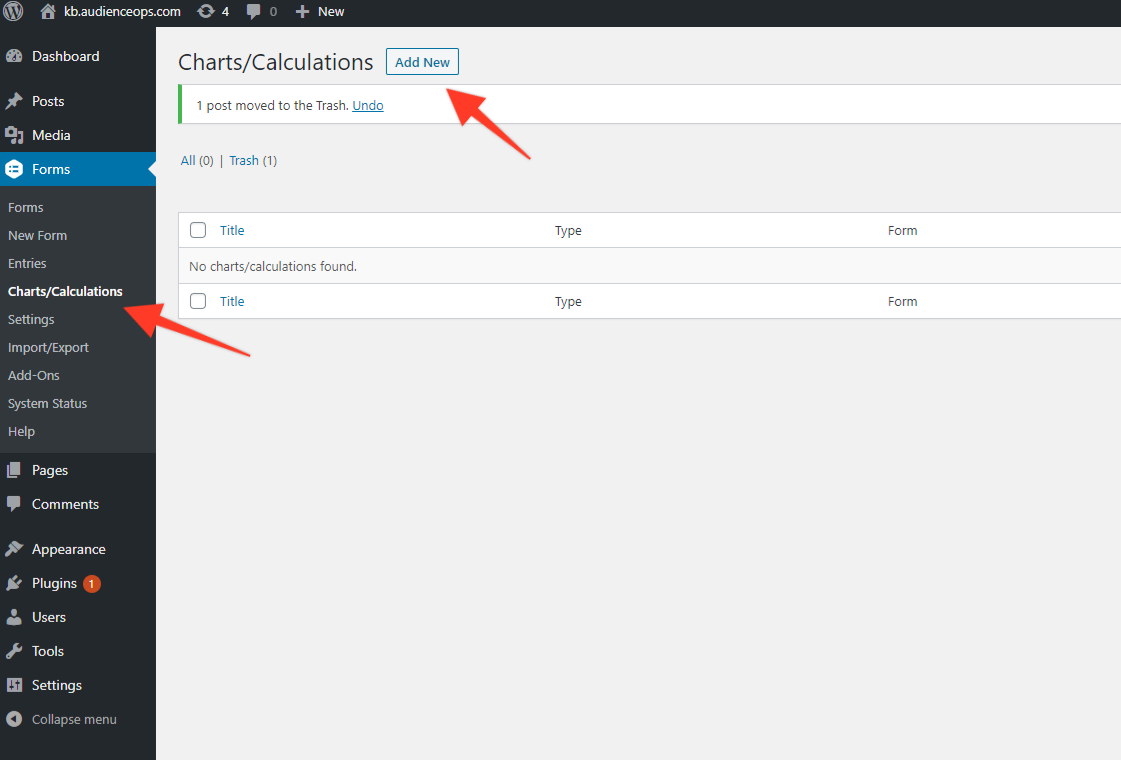
Setting up a GFChart is simple. After creating a Gravity Form (you need to have one set up already), click Forms > Chats/Calculations in your WordPress backend to reach GFChart’s graph builder. Click Add New to get started.
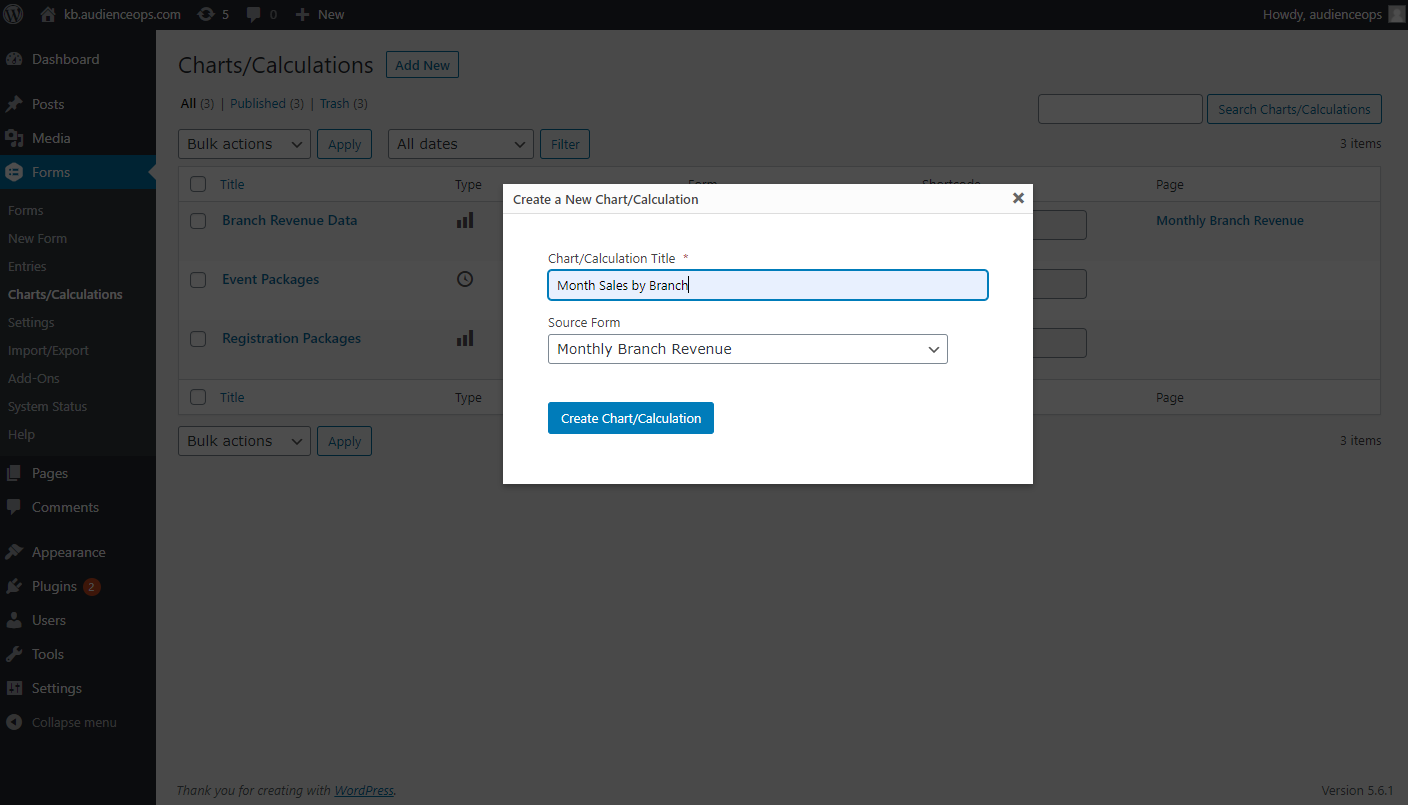
Give your new chart a name. It should be something unique to distinguish it from other charts. Then select the Gravity Form from which the chart will pull data. Click Create Chart/Calculation to enter the chart editor.
The chart editor will walk you through four tabs: Design, Select Data, Customiser, and Preview.
- Design tab: Choose the format of your WordPress chart type. There are several options available. More options will appear below once you choose a format.
- Select Data: Map the individual elements of your chart. For instance, you’ll need to declare which value appears on each axis.
- Customiser: Configure the chart’s design. Customize the chart so that it displays attractively on your site. For instance, you could edit the colors to match your theme.
- Preview: Review your chart before publishing. Ensure that it displays data correctly and looks professional. If you aren’t happy with the chart, you can always navigate back to other tabs and make changes.
When you’re happy with your chart, click Update.
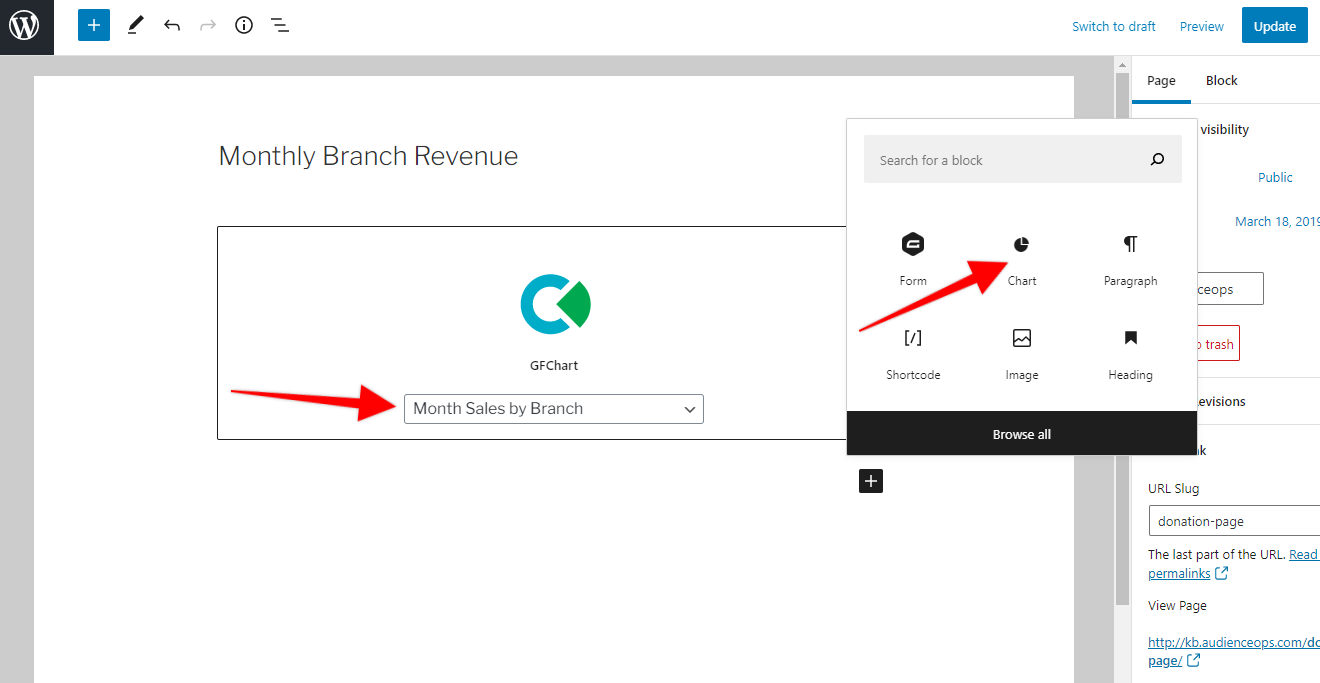
Your final step is to add your chart to a page or post. Fortunately, this is super simple. Visit the editor of any page/post where you want the chart to appear and add the GFChart Gutenberg block. When the block appears in the content editor, use the drop-down menu to select the chart you just created.
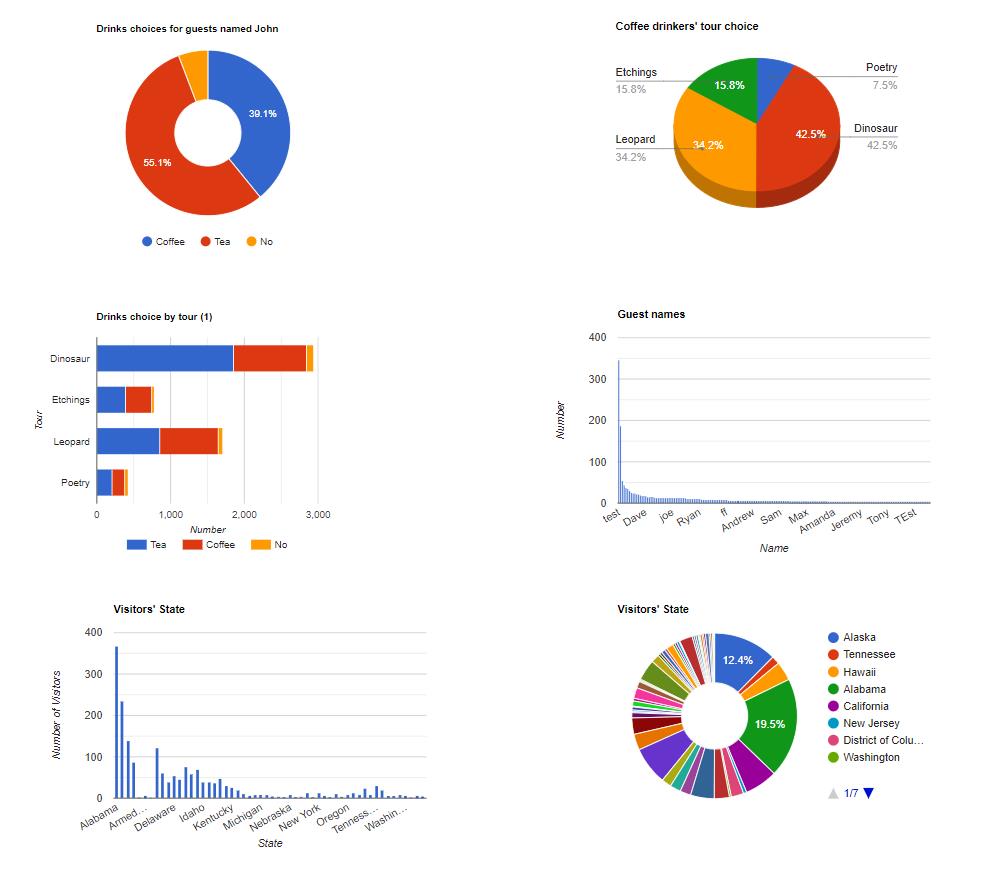
Here are some examples of GFChart’s output. Notice how they are colorful, attractive, and easy to understand. Most importantly, they reflect the data from when the page was last loaded and can be refreshed by simply refreshing the page in the browser. View more sample output.
Learn more in our full walkthrough: WordPress Charts And Graphs: How To Create Beautiful And Responsive Data Visualizations
Option 2: Transfer Data to a Google Sheet
If you just need your Gravity Forms data somewhere else (perhaps so other applications can draw on it), it’s helpful to transfer it to a Google Sheet. From there, you can do just about anything you like with it, now or at a later date.
The big advantage of this system is that you can make your raw data available to other people without giving them access to your WordPress site. Plus, this is a smart way to keep your Gravity Forms data backed up if something unfortunate happens to your WordPress site.
There are two ways to do this. The first is with the Gravity Forms to Google Sheets Add-on. Gravity Forms promotes this plugin (so you know it’s good), but you won’t get support from the Gravity Forms team, as a third-party developer manages it. The cost is $19.
The second method is free with a Zapier integration. Zapier is an intermediary application that connects two other apps. It’s great for making the connection when a native integration doesn’t exist yet. Simply open a Zapier account and follow their steps to set up a Gravity Forms + Google Sheets integration.
Zapier will walk you through the steps to make this integration work. Once you set it up, it will run automatically and indefinitely. Be mindful of the limits on your Zapier account, however. If you reach the total number of monthly actions, your Zapier integration will stop transferring your form data.
Option 3: Generate PDF Reports
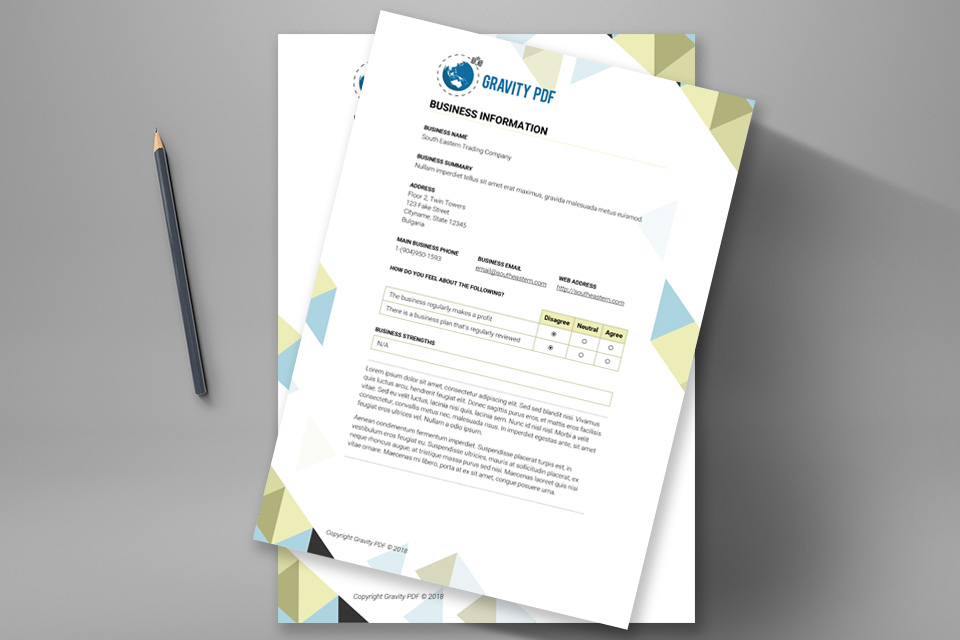
PDF reports are great ways to add a touch of professionalism to your business. They look attractive, and you can pass them around to your team, customers, stakeholders, or readers.
How do you produce PDF reports automatically? With a plugin called Gravity PDF. Gravity PDF is the ultimate self-hosted solution for dynamically creating digital PDF documents using Gravity Forms and WordPress. It allows you to generate PDF documents that contain user data captured with Gravity Forms.
You can generate PDF reports upon user submission or based on a prearranged schedule. Even better, you can set Gravity PDF to email your PDF automatically when a user completes a form. You can even have it emailed to users or people in your organization.
For instance, let’s say you want to send a report to one of your affiliate partners whenever a user completes a lead generation form. Gravity PDF will package it nicely and send it to your partner automatically.
There is a free version of the plugin, so you can try it before committing, but we’re sure you’ll decide to pay for the premium version once you see how powerful it is.
Preset templates determine the look of your PDF reports. Gravity PDF comes with four free template designs, but you can purchase additional templates from the template shop, build your own with HTML and CSS, or hire the team at Gravity PDF to make a custom template for you. If you already have a PDF design you would like to use, Gravity PDF’s team can even auto-populate existing PDF documents, so you don’t have to change.
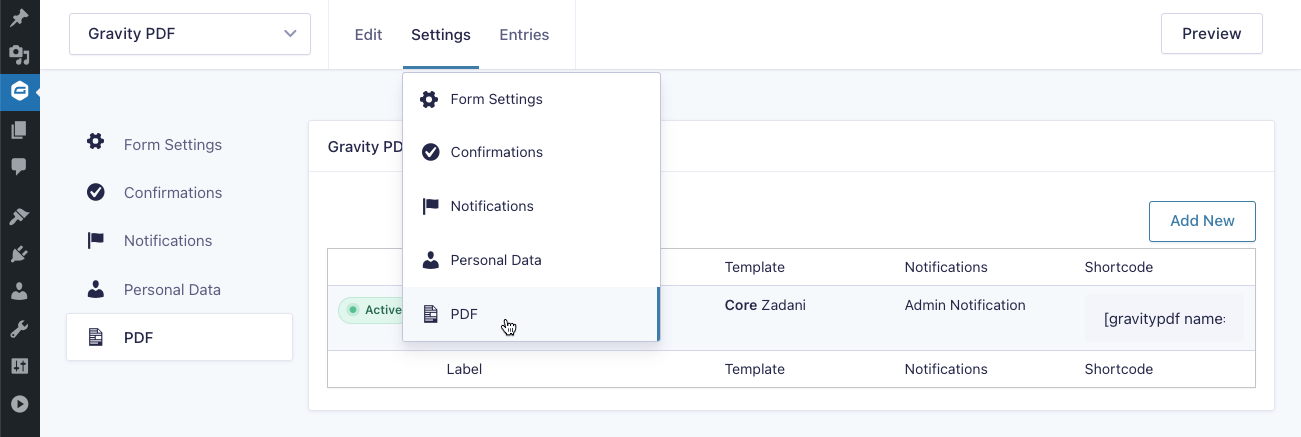
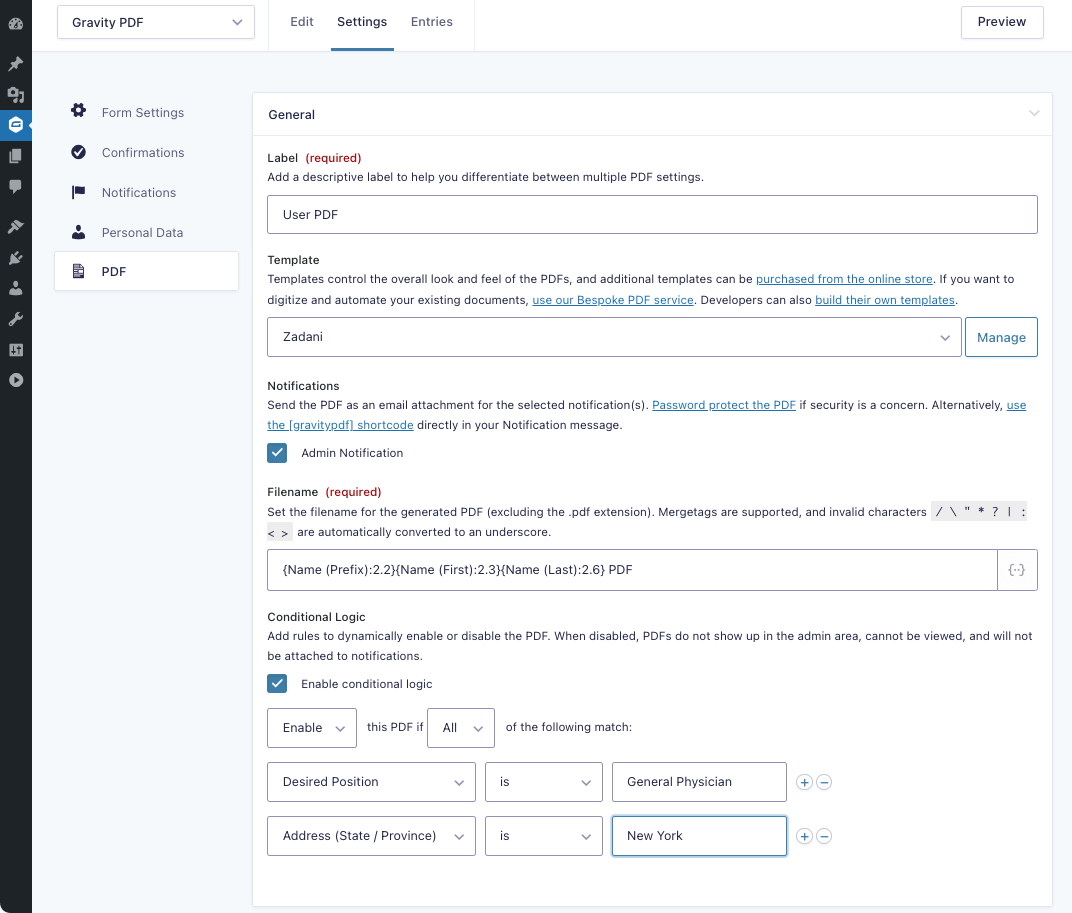
Setting up a PDF report is pretty simple. Just follow Gravity PDF’s quick setup guide. You just have to select the form you want a PDF for and walk through the editor steps.
Then you’ll need to adjust some settings for the individual PDF, such as mapping the fields in your Gravity Form to the right spots on the PDF template. You can also change your colors, fonts, paper size, notifications, header, footer, and more. We strongly recommend carefully combing these settings to make your PDF report unique.
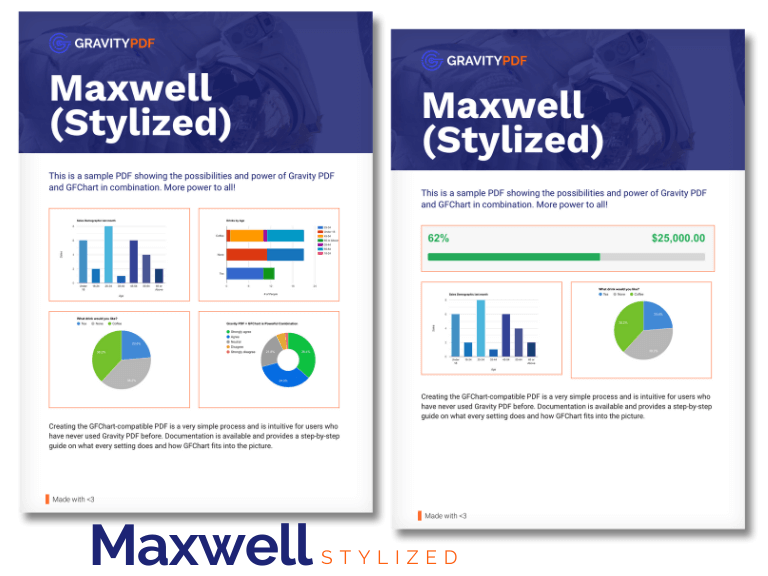
Our favorite part about Gravity PDF is that it works in conjunction with GFChart, which means you can add visually pleasing charts and graphs to your PDFs. Here’s an example of a PDF report with an embedded GFChart.
Key Takeaway
These three simple methods are excellent ways to automate your Gravity Forms reporting. They only take a few minutes to set up but can save you hours in the future. Use whichever method best fits your needs.