Time: 5 mins for one question. Clone others in seconds.
Ingredients: Gravity Forms, GFChart (ALL)
Step 1
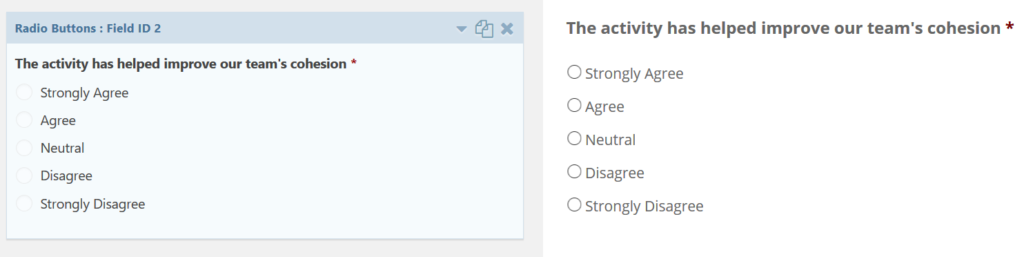
This chart is made using the results from forms using Gravity Forms standard radio buttons (note that advanced survey field radio buttons will not display with labels).
Ensure that your survey has been created within Gravity Forms and there are entries.
Step 2
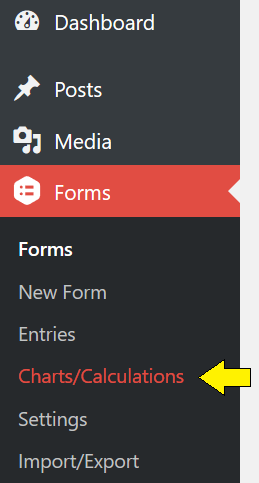
Go to the ‘Forms’ tab on the WordPress dashboard.
Once the GFChart plugin has been installed and activated, click on the sub-tab titled ‘Charts/Calculations’.
Step 3
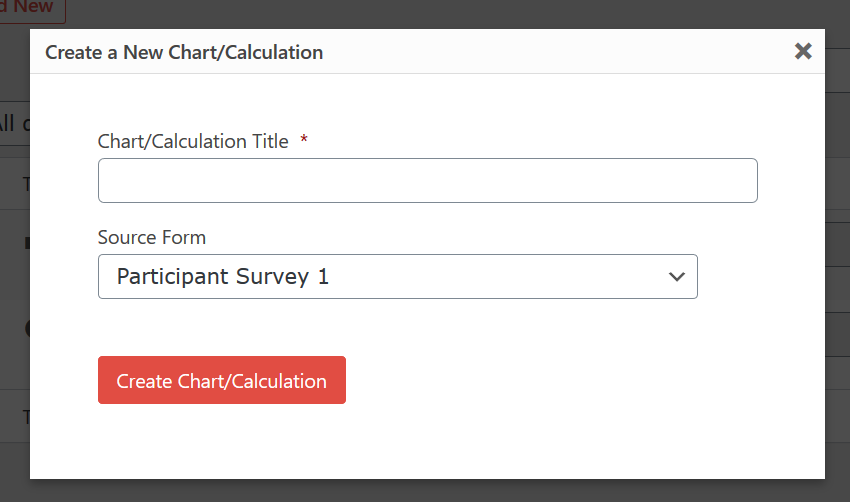
Click ‘Add New’.
In the pop-up box under ‘Chart/Calculation Title’ create the title of your chart.
In ‘Source Form’ use the drop down box to select which Gravity Form you would like to use to create your chart.
Step 4
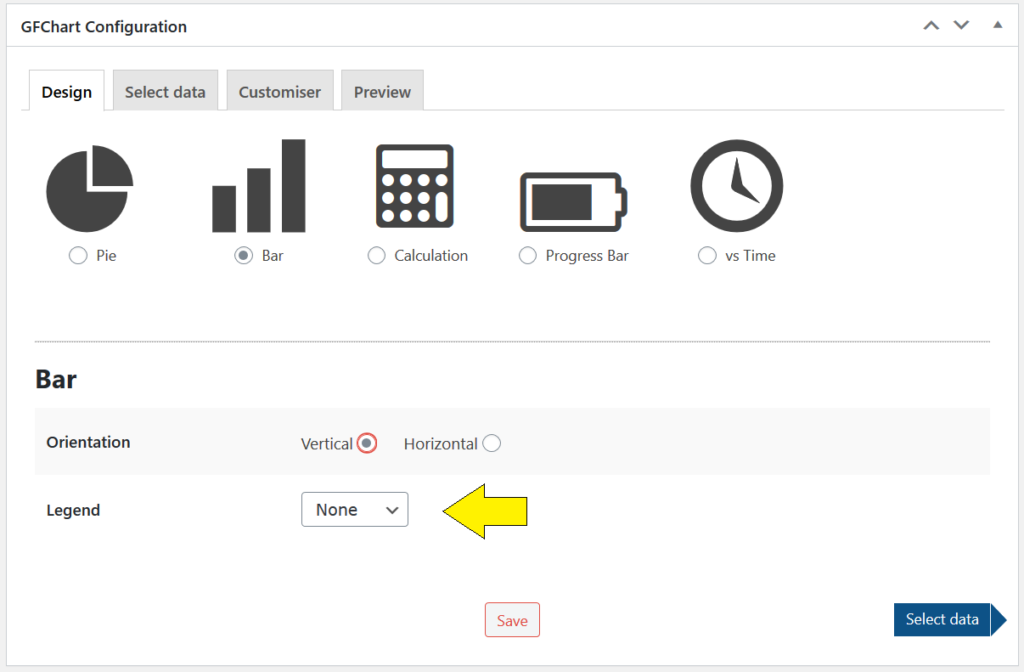
Under GFChart Configuration click ‘Bar’.
Further design options will appear giving you choice of style (do you want your bars to be vertical or horizontal?)
In this example we’ve selected the default style (vertical).
There is no need for a legend because only 1 data series will be presented.
Step 5
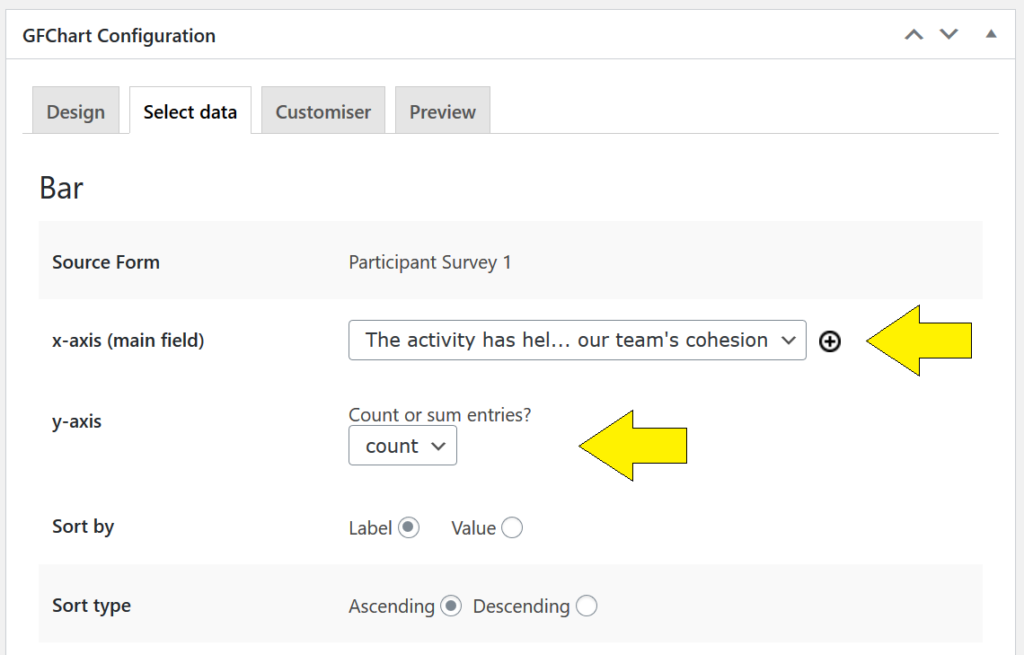
The ‘Select data’ tab will enable you to choose what data you want the chart to present.
Use the drop-down menu under ‘Field’ to select the field from your Gravity Form survey to chart. In this case, chose the field with the radio button questions.
Select ‘count’ or the y-axis.
The bar sorting options are not helpful for surveys and can be ignored. In step 8 we will drag and drop bars into your preferred order.
Step 6
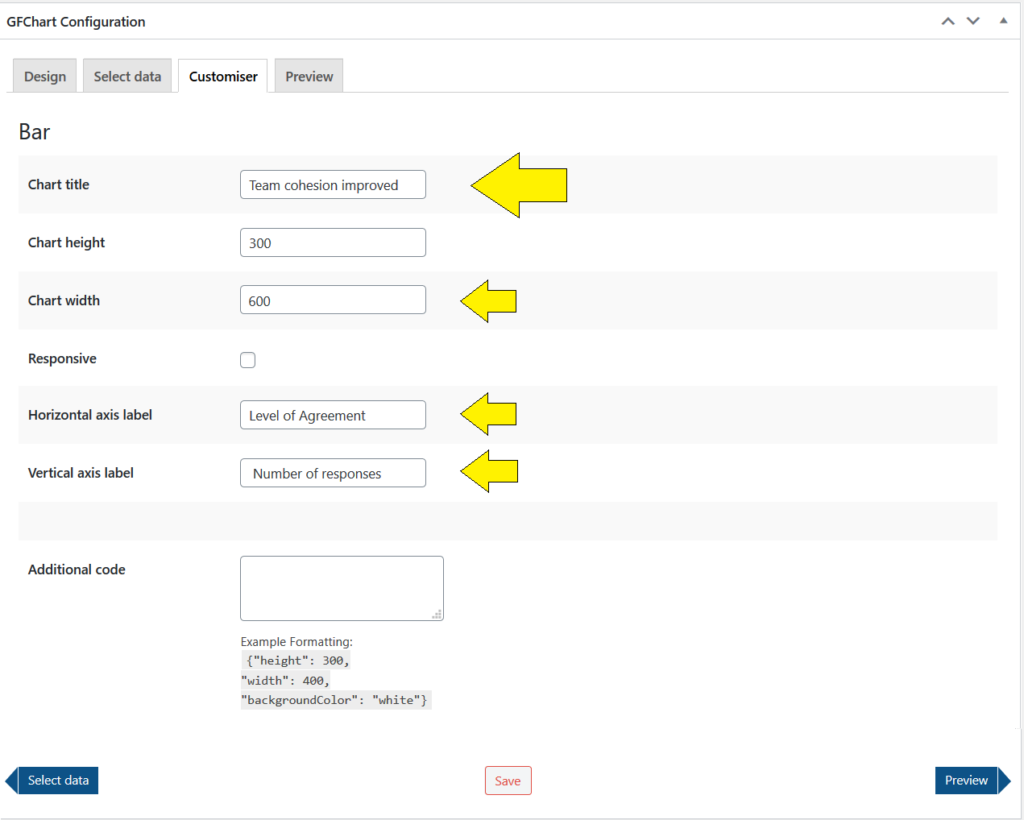
Under the ‘Customiser’ tab you will be able to type in the title you wish to be presented with your chart.
You can also adjust the chart height and width.
Default settings have a height of 300 and a width of 400.
Depending on how many bars and how long each bar’s label is you may need to increase the width. In this example we have extended it to 600.
You can also type in the labels for the horizontal and vertical axes.
Step 7
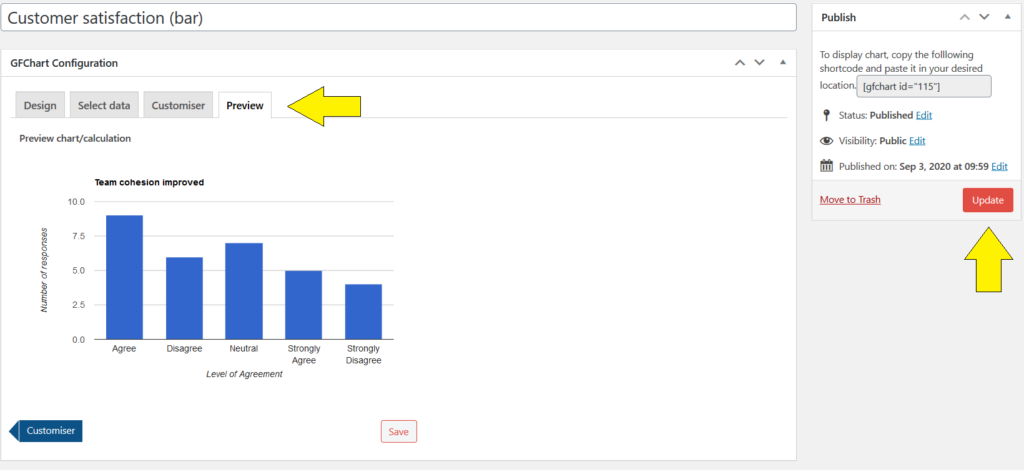
Under the ‘Preview’ tab you will be able to see what your chart looks like.
You can click back through the other tabs to continue adjusting the chart settings, and then come back to preview the effect of any changes.
Once you are satisfied with your bar chat click the red ‘Update’ button within the box labeled ‘Publish’ to the left of the screen.
Note that the ‘Publish’ box also includes the shortcode for this chart.
Step 8
Instal and activate the ‘Survey Customiser’ plugin.
Return to the ‘Customiser’ tab and more options have appeared.
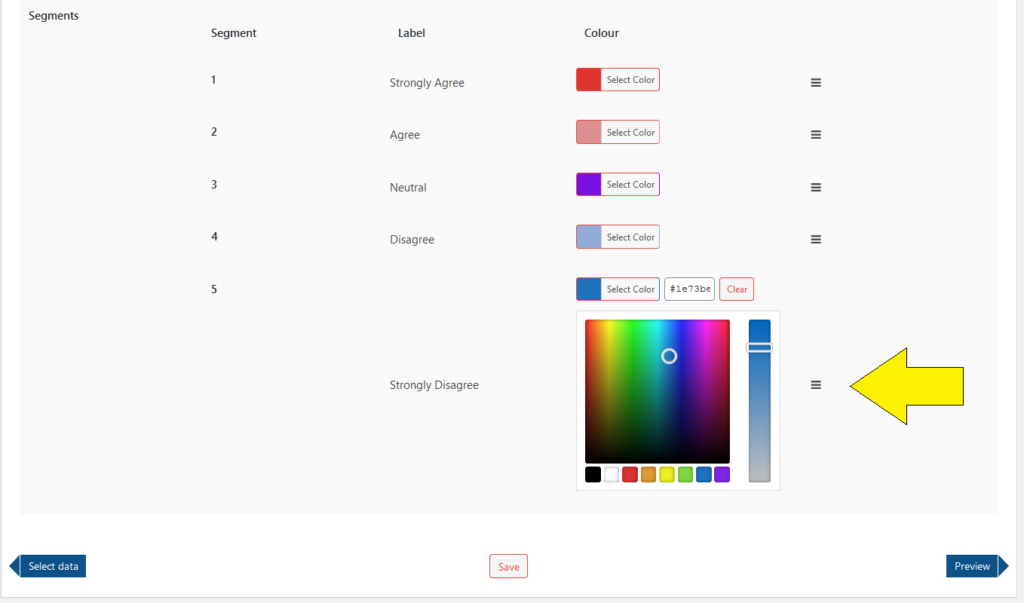
Under ‘Segments’ you can adjust the color for each of the different bars/segments in your chart.
For help with choosing a color palette you may use free online tools such as coolors.
You can also use the three lines ( ≡ ) to drag and rearrange the order of the segments on your chart.
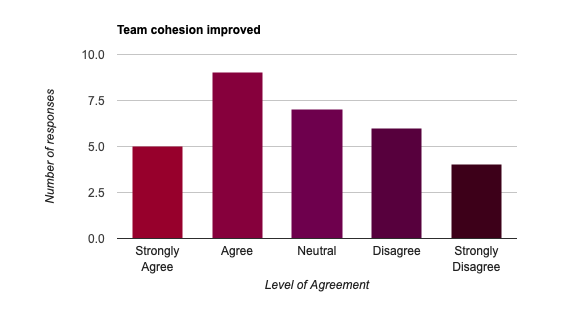
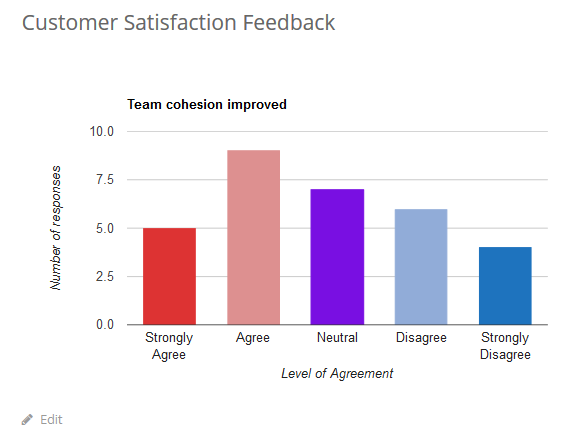
In this example we’ve decided to arrange the segments in order from the highest to lowest level of agreement.
Step 9
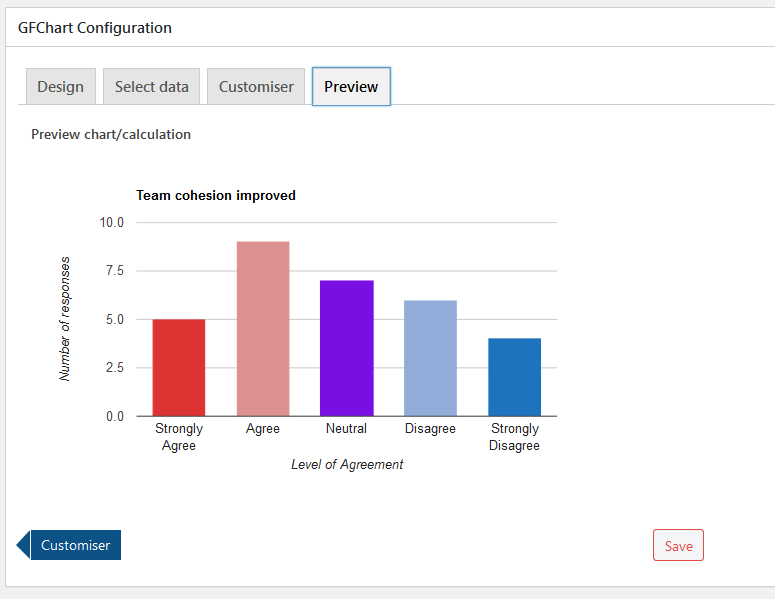
As usual, under the ‘Preview’ tab you will be able to see the outcomes of your customisation.
You can click back through the other tabs to continue adjusting the chart settings, and then come back to preview the effect of any changes.
Step 10
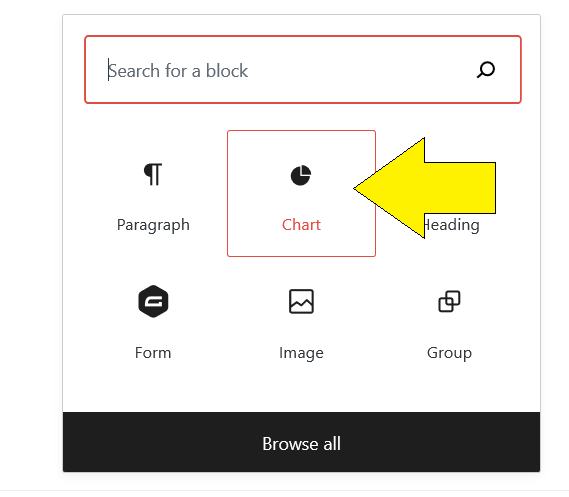
To add your chart to a WordPress page, add a new block and select ‘Chart’.
Step 11
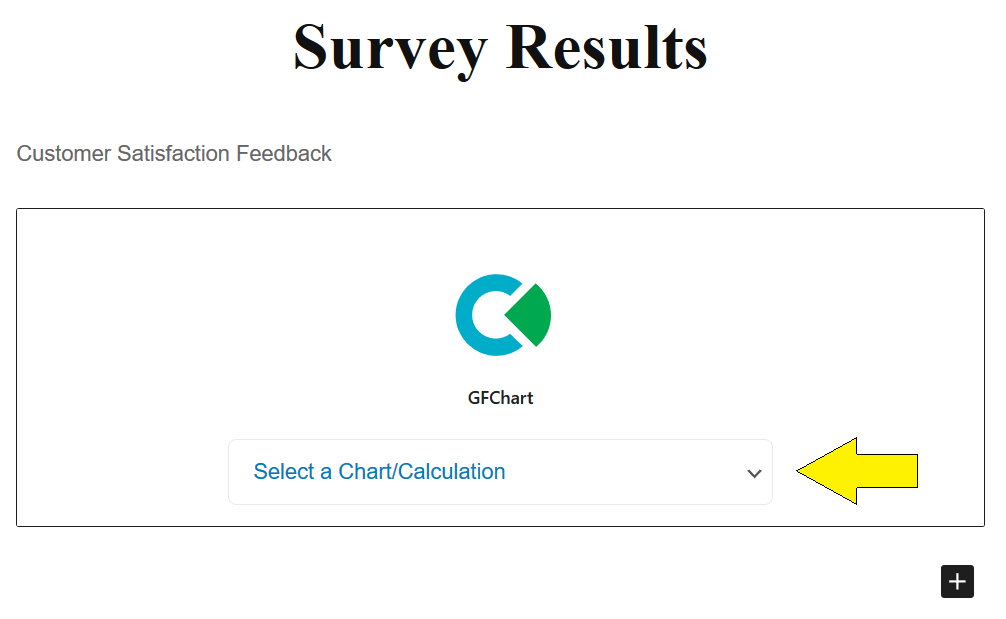
Once the block is added you can use the drop-down box to select which chart you want to include on the page.
Step 12
When the page is previewed or published your selected chart will be visible.
The chart will be automatically updated if new entries are made to the source form. To avoid or control for these updates you can specify a date range under the ‘Select Data’ tab (see Step 5).
Mix it up:
Quickly repeat for other questions using ‘Clone’ button then select a different field under ‘Select data’.
Restrict data set using our powerful backend or shortcode filters.
Enable front end filtering using GravityView (purchase separately) and our GravityView add-on.