
This is a computer generated report based on multiple choice answers you submitted on October 23, 2021. You will understand that these are rapid yet generic answers and their accuracy is not guaranteed! You should rely on your own investigations. Please contact us if you seek more specific advice about our products and solutions.
GFChart solution recommendation
Your use case
GFChart is popular for sales monitoring. Features to consider are:
- Charting vs Time add-on* to monitor sales aggregated by day, week, or month.
- Relative date filtering to automatically filter displayed data to a particular time period, eg last week.
- Payment Status checkbox to filter according to the payment gateway transaction status.
- Additional filtering capability to filter according to other field values. This works particularly well when filtering by drop down fields due to their unique values.
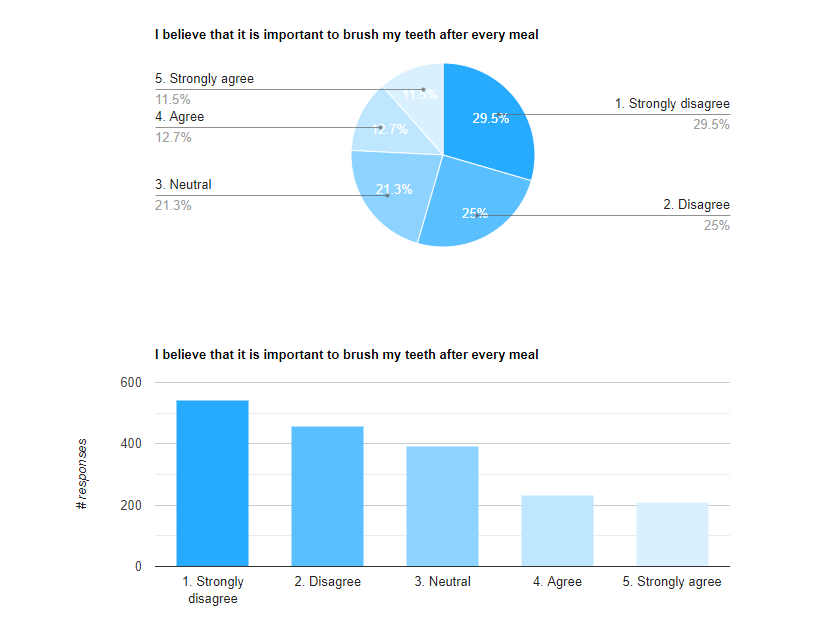
GFChart is ideal for producing survey response reports. Typically customers display results in either bar or pie charts, often immediately after a user completes a survey. Basic color changes are possible in GFChart BASIC but for full control over colors including assignment of colors to responses (eg yes is green) use the Survey Customiser*.
Trends in numerical survey results can be plotted using Charting vs Time add-on**.
For other use cases please contact us so that we can give you more specific advice.
GFChart is great for special projects because you can get up and running very quickly without coding, and you can make chanhges on the fly. There is also no monthly subscription.
Displaying results from multiple form entries is a core GFChart capability.
GFChart is perfect for displaying charts from your numerical data. Pie, Bar, Line, Progress Bar and Radar charts are supported for certain scenarios.
To display a data trend over time we have 2 powerful options:
- Charting vs Time add-on* which displays the trend aggregated by day / week / month. This is ideal for sales or contact form monitoring where the volume per time interval is sought.
- Trend add-on* which displays every datapoint on a time axis. This is ideal for assessment scenarios for monitoring performance changes over time.
Publication
Displaying reports on demand is a core GFChart capability. When the webpage is refreshed the report calculates with the latest data in your form.
When the webpage is refreshed the GFChart report calculates with the latest data in your form.
If people other than you are accessing the report then you should publish it somewhere easily accessible, subject to any access requirements. It is common for reports to be located on a ../dashboard or ../reports URL. Consider whether high level non-sensitive information can be displayed (eg registrations progress) without the need for password protection. This is great to support a large team in the field who can quickly access that information via their smartphone.
Public information can be displayed on any public website page using the GFChart WordPress shortcode or block.
Report design and testing
Where several people will be responsible for report design then you may wish to create special new roles within WordPress to ensure that they can access GFChart administration but not other parts of the WordPress admin environment. We recommend the Members plugin for role based access to the admin side of WordPress. Note some solutions hide menu items but do not block access - this might be adequate for your case, but please understand the difference.
To be frank, as with everthing in WordPress, developers with enough expertise and time will probably be able to tailor a better reporting solution than can GFChart deliver. The benefit of GFChart is that it works very quickly out of the box, is maintained by us so does not add to your code debt, and is highly flexible allowing rapid changes to reflect evolving end user requirements. We also seamlessly integrate with others in the Gravity Forms ecosystem including GravityView, Gravity Flow, Gravity PDF and others.
Our helpful support team understand GFChart in depth and are available for you if required.
If you do not have a dataset available in a live form then simply create a few form entries to take advantage of GFChart.
*requires GFChart ALL (not GFChart BASIC)