
Much as I love GFChart, it’s only designed for very basic analysis of data collected via Gravity Forms. For more advanced analysis, another tool is required. As an experiment I’m trialling Python.
In this post I describe my occasional part-time journey over the last few weeks from knowing nothing about Python, to being able to produce useful business analysis from Gravity Forms data.
Project objective
I have 2 areas of enquiry, both customer geography related. From lists of IP addresses I wanted to know more about:
- Geographic location of GFChart customers
- Investigate whether there are any geographical trends in uptake for online courses we manage for a client
Why Python?
Gravity Forms data can be manually exported via a csv file. Once in that format there are a plethora of data analysis options available, ranging from Microsoft Excel to advanced Business Intelligence packages and everything in between.
Python is a highly popular open source programming language with a reputation as being fairly easy to learn. It is highly extendable using various libraries. I use a Mac Book Pro (running Mojave) as my main workhorse and wanted something that would run on that. I figured that a bit of time spent investigating Python would not be wasted, even if ultimately I wasn’t able to achieve my project objectives.
Getting started with Python
My usual approach with learning new things is to simply dive straight in. This time I opted to first do some background research to get a better feel for capabilities, methods and issues. The book Automate the Boring Stuff with Python by Al Sweigart was my perfect start. The book is designed to quickly get non-coders able to do practical useful things with Python. After purchasing the Kindle version I flicked through it for a couple of hours, and then gradually dived into various sections of the following days to learn specifics.
Another useful tool is the (paid for) Pythonista app on iOS that I installed on my iPad. This allowed me to play around with Python code on my iPad during spare moments, without lugging a laptop around. It was great to get me started, but I haven’t used it since starting to code on my Mac.
Setting up a Python development environment on the Mac
This wasn’t as easy as I had expected!
Macs ship with Python. In theory you simply open a Terminal session, and start. In practice the Python shipped with a Mac is version 2.x. Whilst this is perfectly serviceable, v3.x is the latest and best to use if you are wanting to be sure that you are using the latest production versions of various libraries.
It is possible and very easy to load v3.x onto the Mac using a simple installer from the Python site. This comes with a handy development environment. I used this for a few days before deciding to ditch it because I was having problems adding additional libraries.
Googling around there seems to be various different views of how to set up a ‘good’ development environment on a Mac. In the end after various trials and false starts, I opted for Homebrew and a Virtual Envronment. Now I might not have this perfectly correct, but my understanding is that:
- Homebrew is a great tool for installing new code libraries onto a Mac, and keeping them up to date. I use it for Python (core) and additional libraries.
- A virtual environment is allows you to create project specific development environments. By being project specific, you can make as many changes as you want without risk of corrupting the core software on your machine. Note that there is more than one method of running a virtual environment. The method I used is described here.
In retrospect, I realise that everything above describes my journey over the last few weeks. There was nothing wrong with any of the steps that I took, and each taught me something. Maybe if I had tried to shortcut straight to my (currently) ideal method it wouldn’t have worked.
Converting IP addresses to geographic locations
We use Easy Digital Downloads (not Gravity Forms) to sell GFChart. One of the reports this produces contains customer IP addresses and these were exported into a CSV file.
IPStack provides an API to convert an IP address into a geographic location (Continent, Country, Region, City, Zip, Latitude and Longitude). They have a free tier for limited usage. Depending on internet network architecture, the location returned may not be perfect, especially below Region / City level, but it’s a guide.
Another option is Abstract who have an extensive collection of APIs including the ability to geolocate IP addresses to obtain detailed information.
In Python using its csv, json and requests libraries we wrote a simple script to identify the geographic location of each customer and save into a new csv file. The resulting file was them imported into Microsoft Excel and graphical analysis conducted using pivot table functionality.
Our initial segmentation was by Continent and Country. A large number of our customers are in the USA, so for those we further segmented by State. One particularly interesting chart shows US customers by State (blue line) alongside the GDP per state (red column), see below.
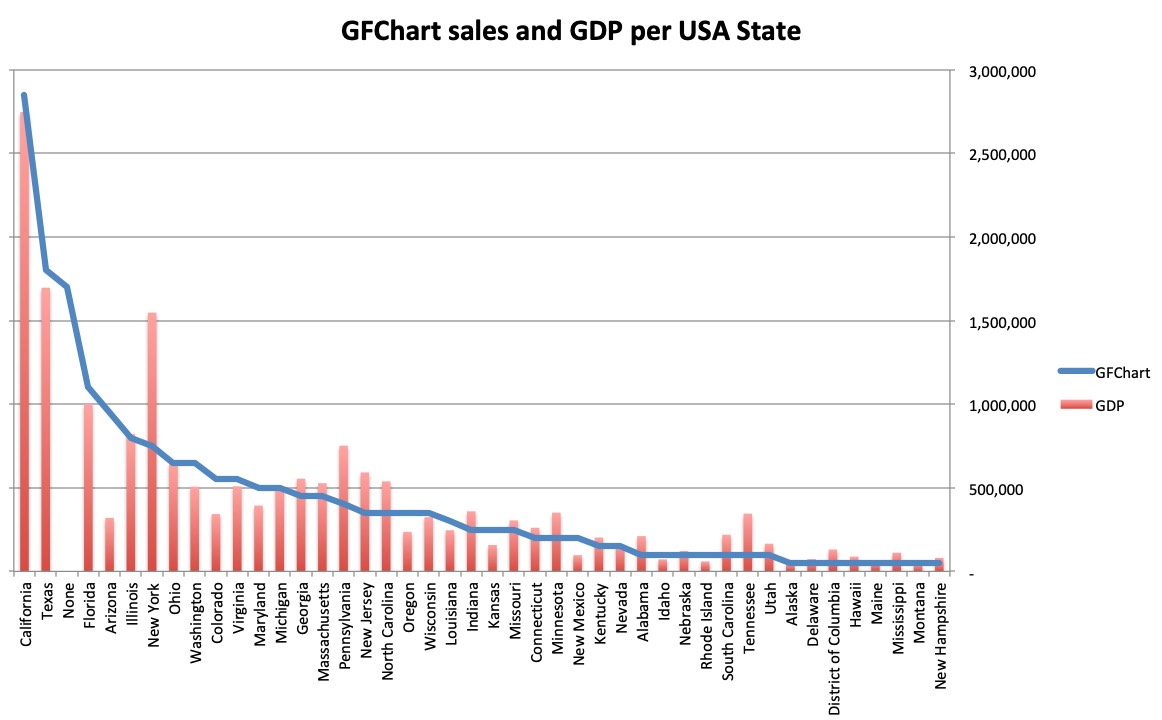
My hypothesis is that GDP is valid indicator of customer volume per State. Where the red column exceeds the blue line, we are under-performing on sales. See particularly New York, Pennsylvania, New Jersey, North Carolina and Tennessee. This indicates that in the west and southern USA are sales are strong, whereas in particularly the North East they are weak. Whether this is GFChart specific, or WordPress generally I don’t know. This is only a hypothesis and may not be valid at all!
Our first objective has been achieved using Python and Excel.
[To be continued]